Johnson
Johnson. Nixon. Ford. Carter. Clinton. Reagan. Bush. Bush. 22%. 7%. 28%. 43%. Comparison 1965 - 2003. United States Budget. 8%. 8%. 18%. 66%. Discretionary. National Defense. Entitlements. Net Interest. -58%. +136%. +14%. -64%. ARD Air Quality Monitoring Objectives.

Johnson
E N D
Presentation Transcript
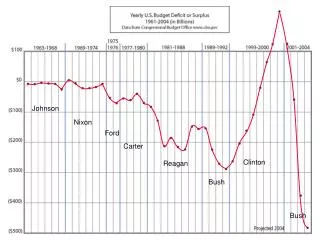
Johnson Nixon Ford Carter Clinton Reagan Bush . Bush
22% 7% 28% 43% Comparison 1965 - 2003 United States Budget 8% 8% 18% 66% Discretionary National Defense Entitlements Net Interest -58% +136% +14% -64%
ARD Air Quality Monitoring Objectives • Provide data to make pollutant risk assessments of adverse effects to natural resources (AQRVs). • Determine compliance with NAAQS standards and critical loads • Determine trends that assist in compliance predictions, policy objectives, and regional assessments at rural parks. • Provide specific answers from special studies that assist modeling, rural pollution transport issues, SIP development, and national control strategies. • Provide timely information to protect public health in the parks Air Resources Division
Monitoring Concept Changes • Three-tier monitoring: core for trends, baseline, targeted • Co-locate monitoring for efficiency and data use • Use partnerships to maximize cost sharing • Set primary objectives for each site, time frame follows • Target the monitoring by defining the information needs • Parameters and quality of data to meet the need Air Resources Division
Define Monitoring by a Layered Structure Each monitor must be defined by its layer, purpose, and timeline. Air Resources Division
Number Years Monitoring Data Death Valley 11 Mount Rainier Great Smoky Mountains - Cades Cove Mesa Verde 12 Great Basin Craters of the Moon Great Smoky Mountains - Clingmans Dome Channel Islands Chamizal Canyonlands Big Bend 15 Olympic Yosemite - Turtleback Dome Glacier Chiricahua Lava Beds Grand Canyon 17 Cowpens Great Smoky Mountains - Cove Mtn Yellowstone Voyageurs Rocky Mountain Pinnacles Joshua Tree Everglades Denali Cape Cod Mammoth Cave Great Smoky Mountains - Look Rock Theodore-Roosevelt Shenandoah Sequoia-Kings Canyon - Lower Kaweah Saguaro Acadia - McFarland Hill 0 5 10 15 20 25 Congaree Swamp Years of Data Air Resources Division
Air Quality “Air Atlas” A geographic information system (GIS) and ozone data was used to spatially interpolate the ozone over the US. http://www2.nature.nps.gov/air/maps/AirAtlas/index.cfm Air Resources Division
Air Quality Condition – Ozone Trend Air Resources Division
Air Quality Scorecard Air Resources Division
BADL WICA ZION PEFO Station shut down CASTNet Sites = ozone + dry deposition Minor reduction(met, 2nd site, temp monitors POMS ozone (not shown) 8 stations not funded by 2011 Cost Saving Cuts - Ozone Monitoring Air Resources Division