Download
1 / 23
230 likes | 358 Vues
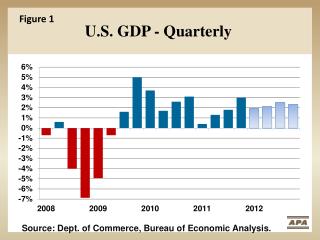
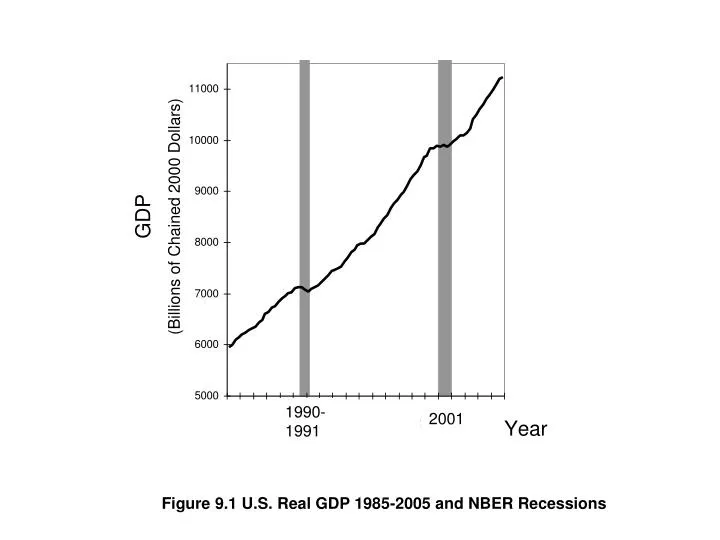
Figure 9.1 U.S. Real GDP 1985-2005 and NBER Recessions. Figure 9.2 U.S. Unemployment Rate 1985-2005 and NBER Recessions. Figure 9.3 Inflation Rate 1985-2005 and NBER Recessions. Figure 9.4 A Stylized Business Cycle. Table 9.1 The Early Years of the Great Depression in the United States.

E N D
Figure 9.2 U.S. Unemployment Rate 1985-2005 and NBER Recessions
Table 9.1 The Early Years of the Great Depression in the United States
Figure 9.5 The Output-Income-Spending Flow of an Economy in Equilibrium
Figure 9.6 The Output-Income-Spending Flow with Leakages and Injections
Figure 9.7 The Classical Model of the Market for Loanable Funds
Figure 9.8 Adjustment to a Reduction in Intended Investment in the Classical Model
Figure 9.9 Macroeconomic Equilibrium at Full Employment in the Classical Model
Table 9.3 Deriving Aggregate Demand from the Consumption Function and Investment
Figure 9.13 Aggregate Demand with a Higher Level of Intended Investment
Table 9.5 The Possibility of Excess Inventory Accumulation or Depletion
Figure 9.15 Full Employment Equilibrium with High Intended Investment