Neuronal Activation, Microglial Restructuring, and Neurovascular Adhesion in Stress-Responsive Brain Regions
90 likes | 108 Vues
This study investigates the effects of repeated social defeat stress on neuronal activation, microglial restructuring, and neurovascular adhesion in threat appraisal brain regions in male mice. The results show significant changes in neuronal activation, microglial activation, and vascular endothelial activation after social stress.

Neuronal Activation, Microglial Restructuring, and Neurovascular Adhesion in Stress-Responsive Brain Regions
E N D
Presentation Transcript
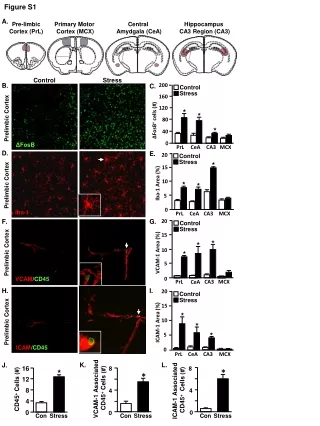
Figure S1 A. Pre-limbic Cortex (PrL) Primary Motor Cortex (MCX) Central Amydgala (CeA) Hippocampus CA3 Region (CA3) Control Stress B. C. 200 160 120 * * ΔFosB+ cells (#) Prelimbic Cortex 80 * 40 ΔFosB 0 PrL CeA CA3 MCX D. E. 20 * 15 Iba-1 Area (%) 10 * * Prelimbic Cortex 5 Iba-1 0 PrL CeA CA3 MCX F. G. 20 15 * * VCAM-1 Area (%) 10 Prelimbic Cortex * 5 VCAM/CD45 0 PrL CA3 MCX CeA H. I. 20 15 * ICAM-1 Area (%) Prelimbic Cortex 10 * Control Control Control Control Stress Stress Stress Stress * 5 ICAM/CD45 0 PrL CeA CA3 MCX K. L. J. 8 16 8 * * * 12 VCAM-1 Associated CD45+ Cells (#) ICAM-1 Associated CD45+ Cells (#) CD45+ Cells (#) 8 4 4 4 0 0 0 Con Stress Con Stress Con Stress
Figure S1. Social stress caused the co-occurrence of neuronal activation, microglial restructuring, and neurovascular adhesion of monocytes within threat appraisal brain regions. Male C57BL/6 mice were subjected to 6 cycles of repeated social defeat (Stress) or left undisturbed as controls. Mice were perfused and the brain was PFA fixed 14 h after the last cycle of stress. Neuronal activation (ΔFosB), microglial activation (Iba-1), vascular endothelial activation (VCAM-1 & ICAM-1), and the presence of monocytes (CD45+) in the vasculature (ICAM-1/CD45 or VCAM-1/CD45) were assessed. A) Illustration of threat appraisal centers used in the study. Representative images within the prelimbic cortex of B) ΔFosB, D) Iba-1, F) VCAM-1/CD45, and H) ICAM-1/CD45 labeling. Insets show enlarged images of positive labeling. C) Number of FosB+ cells (Stress x Region interaction; F(3,29)=4.97, p=0.008), E) Iba-1 proportional area (Stress x Region interaction; F(3,31)=20.98, p<0.0001), G) VCAM-1 (Stress x Region interaction; F(3,34)=6.22, p=0.0022), and I) ICAM-1 (Stress x Region interaction; F(3,32)=5.39, p=0.0049) proportional area within threat appraisal centers after social stress. J) The number of CD45+ cells (F(1,10)=9.42, p=0.0134), the number of CD45+ cells associated with K) VCAM-1 (F(1,9)=25.20, p=0.001) and L) ICAM-1 positive blood vessels (F(1,9)=7.47, p=0.0257). Bars represent the mean ± SEM. Means with asterisk (*) are significantly different from the corresponding control mice (p<0.05), according to F-protected post hoc analysis.
Figure S2 A. 280 240 * * * 200 160 ΔFosB+ cells (#) 120 * # # 80 40 0 Veh CZP Mino Veh CZP Mino Veh CZP Mino CA3 Motor CeA B. 10 8 # * 6 Iba-1 Area (%) * 4 2 0 Veh CZP Mino Veh CZP Mino Veh CZP Mino Control Control Control Control Control CA3 Motor CeA Stress Stress Stress Stress Stress C. D. 10 * 14 8 12 * 6 VCAM-1 Area (%) * VCAM-1 Area (%) * 8 4 * 4 2 0 0 Veh CZP Mino Veh CZP Mino Veh CZP Mino Veh CZP Mino CA3 Motor CeA PrL E. 20 * 15 * * 10 ICAM-1 Area (%) * * * 5 0 Veh CZP Mino Veh CZP Mino Veh CZP Mino CA3 Motor CeA
Figure S2. Effect of clonazepam and minocycline on neuronal, microglial, and endothelial activation in stress-responsive regions. Male C57BL/6 mice received either minocycline in their drinking water, clonazepam injections i.p., or vehicle treatment daily two days before and during social defeat (Stress). Mice were perfused and the brain was PFA fixed 14 h after the last cycle of stress. Neuronal activation (ΔFosB), microglial activation (Iba-1) and vascular endothelial activation (VCAM-1 & ICAM-1) were assessed. A) Quantification of ΔFosB+ cells in the CeA (Stress x Drug interaction, F(2,34)=4.46, p=0.0202), CA3 (Stress x Drug interaction, F(2,36)=7.94, p=0.0016) and Motor Cortex is shown. B) Iba-1 proportional area in the CeA, CA3 (Stress x Drug interaction, F(2,31)=13.37, p<.0001) and Motor Cortex is shown. C) VCAM-1 proportional area in the CeA (Stress x Drug interaction, F(2,31)=17.52, p<.0001), CA3 (Stress x Drug interaction, F(2,29)=9.08, p=0.0011) Motor Cortex, and D) PrL (Stress x Intervention interaction, F(2,31)=8.39, p=0.002) are shown. E) ICAM-1 proportional area in the CeA (Stress x Drug interaction, F(2,33)=6.90, p=0.0035), CA3 (Stress x Drug interaction, F(2,31)=4.01, p=0.0298) and Motor cortex (Stress x Drug interaction, F(2,32)=6.74, p=0.0041). Bars represent the mean ± SEM. Means with asterisk (*) are significantly different from the corresponding control mice (p<0.05), and means with (#) tended to be different from control mice (p<0.1), according to F-protected post hoc analysis.
Figure S3 C. A. D. B. Vehicle Vehicle 400 400 300 Minocycline Minocycline * 300 * 300 * 200 * Social Interaction Time in Corner Zone (s) Social Interaction Time in Corner Zone (s) Social Interaction Time in Interaction Zone (s) Social Interaction Time in Interaction Zone (s) 200 200 100 100 100 # # * * 0 0 0 Con Con Stress Stress Con Stress Con Stress Figure S3. Inhibiting microglial activation or depleting microglia during stress does not prevent social avoidance behavior. Male C57BL/6 mice received minocycline or vehicle in their drinking water two days before and during social defeat (Stress). Mice were tested for social avoidance 14 h after the last cycle of stress. Time spent in the A) interaction zone (main effect of Stress; F(1,29)=163.62, p<.0001) and B) corner zone (main effect of Stress; F(1,29)=186.38, p<.0001). In a separate experiment, male C57BL/6 mice were provided with a diet of PLX5622 (1200 ppm chow) or vehicle chow for 14 days and then exposed to repeated social defeat (Stress) or left undisturbed as controls. Mice were tested for social avoidance 14 h after the last cycle of stress. Time spent in the C) interaction zone (main effect of Stress; F(1,12)=8.31, p=0.0181) and D) corner zone (main effect of Stress; F(1,12)=20.51, p=0.0014). Bars represent the mean ± SEM. Means with asterisk (*) are significantly different from the corresponding control mice (p<0.05), and means with (#) tended to be different from control mice (p<0.1), according to F-protected post hoc analysis. 300 Vehicle Vehicle 200 PLX PLX 100 0
Figure S4 A. 100 80 * * 60 ΔFosB+ cells (#) 40 20 0 PLX PLX Veh Veh PLX Veh CeA CA3 Motor B. 15 * 10 * Iba-1 Area (%) 5 0 PLX PLX Veh Veh PLX Veh CeA CA3 Motor D. C. 20 20 * 15 15 * VCAM-1 Area (%) * * VCAM-1 Area (%) 10 10 * * 5 5 0 0 Veh PLX PLX Veh Veh PLX Veh PLX PrL CeA CA3 Motor E. 30 Control Control Control Control Control Stress Stress Stress Stress Stress 25 * * 20 * ICAM-1 Area (%) 15 * 10 5 0 PLX PLX Veh Veh PLX Veh CeA CA3 Motor
Figure S4. Microglial depletion with CSF1R antagonist does not prevent threat appraisal or endothelial activation within stress-responsive brain regions. Male C57BL/6 mice were provided with a diet of PLX5622 (1200 ppm chow) or vehicle chow for 14 days and then exposed to repeated social defeat (Stress). Mice were perfused and the brain was PFA fixed 14 h after the last cycle of stress. Neuronal activation (ΔFosB), microglial activation (Iba-1) and vascular endothelial activation (VCAM-1 & ICAM-1) were assessed. A) Quantification of ΔFosB+ cells in the CeA (main effect of Stress, F(1,16)=21.23, p=0.0006), CA3, and Motor Cortex. B) Iba-1 proportional area in the CeA (Stress x Drug interaction; F(1,16)=25.75, p=0.0002 & main effect of Drug, F(1,16)=171.75, p<.0001), CA3 (Stress x Drug interaction; F(1,16)=9.44, p=0.0089 & main effect of Drug F(1,16)=93.44, p<.0001) and Motor Cortex (main effect of Drug F(1,15)=197.84, p<.0001). C) Quantification of VCAM-1 positive area in the CeA (main effect of Stress; F(1,16)=43.79, p<.0001), CA3 (main effect of Stress; F(1,16)=31.94, p<.0001), Motor cortex, and D) PrL (Stress x PLX interaction; F(1,14)=23.84, p=0.0005 & main effect of PLX F(1,14)=21.91, p=0.0007). E) Quantification of ICAM-1 positive area in the CeA (main effect of Stress; F(1,16)=38.98, p<.0001), CA3 (main effect of Stress; F(1,17)=46.90, p<.0001 & main effect of Drug; F(1,16)=107.33, p<.0001) and Motor Cortex. Bars represent the mean ± SEM. Means with asterisk (*) are significantly different from the corresponding control mice (p<0.05), according to F-protected post hoc analysis.
Figure S5 B. A. 100 Casp1WT 8 Casp1WT Casp1KO Casp1KO 80 6 * * * 60 * % Ly6Chi Monocytes in circulation % Cells in BM 4 40 * 2 * 20 * * * * 0 0 Con Stress Con Stress Con Stress Con Stress Con Stress Granulocytes Erythrocytes Lymphocytes Monocytes E. F. G. 120 12 60 Con-Casp1WT Stress-Casp1WT Stress-Casp1KO C. D. 10 * 6 80 8 40 1.49% 2.68% 2.80% Open Field Time to Enter Center (s) 4 Open Field Duration in Center (s) * Enriched CD11b+ Cells IL-1b mRNA (Fold D) 6 # # 3 40 * 4 20 CD45 % Brain Macrophages 2 2 0 0 0 1 Con Stress Con Stress Con Stress 0 Con Stress CD11b Casp1WT Casp1WT Casp1WT Casp1WT Casp1KO Casp1KO Casp1KO Casp1KO #
Figure S5. Peripheral immune activation during stress is not modulated by Caspase-1. Male C57BL/6 WT and Caspase-1KO (Casp1-/-) mice were exposed to repeated social defeat (Stress) or left undisturbed as controls. Anxiety-like behavior was determined 14 h after the last cycle of stress and then samples (bone marrow, blood, and brain) were collected. A) Percentage of bone marrow monocytes (main effect of Stress; F(1,15)=91.02, p<0.0001), granulocytes (main effect of Stress; F(1,15)=67.73, p<0.0001), lymphocytes (main effect of Stress; F(1,15)=155.55, p<0.0001) and erythrocytes (main effect of Stress; p<0.0001). B) Percentage of circulating Ly6Chi monocytes in the blood (main effect of Stress; F(1,15)=42.75, p<.0001). C) Representative bivariate dot plots of CD11b and CD45 labeling on enriched brain macrophages and microglia. D) Percentage of CD45hi macrophages in the brain (main effect of Stress; F(1,14)=8.40, p=0.0159). E) IL-1β mRNA levels in enriched CD11b+ cells from the brain (main effect of Stress; F(1,21)=24.69, p<.0001). F) Latency to enter the center of the open field (main effect of Stress; F(1,41)=1.73, p=0.1974) and G) time spent in the center of the open field (main effect of Stress;F(1,40)=8.37, p=0.0066). Bars represent the mean ± SEM. Means with asterisk (*) are significantly different from the corresponding control mice (p<0.05), and means with (#) tended to be different from control mice (p<0.1), according to F-protected post hoc analysis.


