Download
1 / 27
270 likes | 412 Vues
Inflection Points and Polar Bears. Jason Hamilton Thomas J. Pfaff. Glacier Pair Images. http://www.windows.ucar.edu/teacher_resources/glacier_then_now.pdf. A Look at Global Temperature . T(x)=0.0005x 2 -0.00527x+57.137 F T’(x)=0.001x-0.00527 F/year x years after 1950

E N D
Inflection Points and Polar Bears Jason Hamilton Thomas J. Pfaff
Glacier Pair Images • http://www.windows.ucar.edu/teacher_resources/glacier_then_now.pdf
A Look at Global Temperature T(x)=0.0005x2 -0.00527x+57.137 F T’(x)=0.001x-0.00527 F/year x years after 1950 • T(58)= 58.51 F and T’(58)=0.0528 F/year • In 2008 the average global temperature was 58.51 deg F and increasing at a rate of 0.0528 deg F per year. - Now Ask a Question About This-
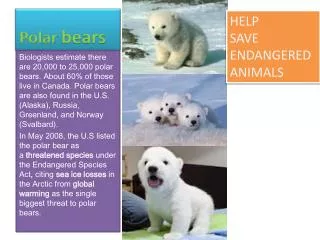
National Academies Report: Climate Change The rising temperature observed since 1978 are particularly noteworthy because the rate of increase is so high and because, during the same period, the energy reaching the Earth from the Sun had been measured precisely enough to conclude that Earth’s warming was not due to changes in the Sun. -March 2006
Temperature Predictions • T(100)=61.60 F and T(150)=67.61 F • The model predicts that in 2050 the average temperature will be 61.6 deg F, and in 2100 it will be 67.61 deg F, an increase of 3.49 and 9.48 deg F, respectively, since 2000. –Now Ask a Question About This-
More Temperature Predictions • Using T’(58)=.0528 F/year • If global temperatures continue to increase at current rates, then by 2050 there will be an increase of 2.61 deg F and by 2100 there will be an increase of 5.24 deg F since 2000. The average global temperature in those years will be 60.73 and 63.37, respectively.
Summary of Sea Ice • 1980 • Max: 16.13 msk, x=2.59 • Min: 7.86 msk, x=8.79 • Inf: -2.20 msk/month, x=6.44 • Melt Period: 6.20 months • 2008 • Max: 15.11 msk, x=2.26 • Min: 5.40 msk, x=8.80 • Inf: -2.84 msk/month, x=6.77 • Melt Period: 6.54 months
Who Cares? D Heat content of atmosphere & hydrosphere • Air Temperature & D Water Temperature D Ice
DIce • Spatial Extent? • Thickness? • Timing of thaw? • Timing of re-freeze? • Ice characteristics?
January Males Freeze Grow March Sept Shrink Thaw June
Females January Cubs Freeze Leave den March Sept Mate Den Thaw June
Questions? • Jason:jhamilton@ithaca.edu • Tom: tpfaff@ithaca.edu Partly supported by NSF DUE-0837721