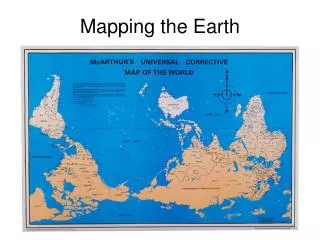
Mapping the Earth
560 likes | 713 Vues
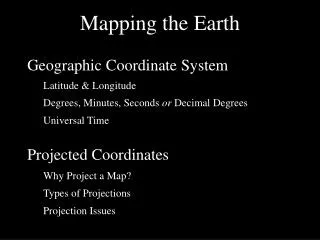
Mapping the Earth. Differentiate between planimetric and hypsometric maps List and recognize the ways in which 3 dimensions can be portrayed on a paper (2 dimensional) map. Define/describe map projections Identify common projection shapes Define/describe an undevelopable surface

Mapping the Earth
E N D
Presentation Transcript
Differentiate between planimetric and hypsometric maps • List and recognize the ways in which 3 dimensions can be portrayed on a paper (2 dimensional) map. • Define/describe map projections • Identify common projection shapes • Define/describe an undevelopable surface • Identify where distortion is minimized and maximized in a projection • Describe why a Mercator projection distorts area towards the poles. • Define/describe: cartographic scale, ecological scale, grain, extent, representative fraction • Explain why maps are models • Explain the differences between a large and small cartographic scale in terms of detail and surface area represented. • Match locations according to their latitude and longitudeState the latitude and longitude for Lexington • State the latitude and longitude for the Tropics of Cancer, Capricorn and for the Arctic and Antarctic circles. • Explain how time zones are designed • Explain UTC time • Describe the difference between geographic and magnetic north
What is a map? • A map is a model used to convey patterns of physical or human processes and patterns • Maps are idealized representations of reality. • General map formats: • Mental or cognitive maps • Hardcopy (paper) maps • Virtual (digital code) maps
Map information • Planimetric • Two-dimensional information • Hypsometric • Two dimensions plus a third dimension • Third dimension is typically relief or topography • Ways of depicting relief • Shading • Contour lines
9. Maps invoke symbolism
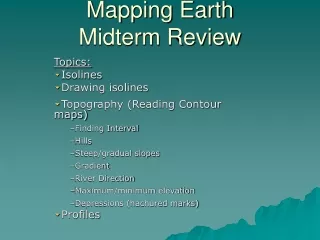
Uphill direction Rapid change in elevation. Contour lines close together. Slow change in elevation. Contour lines far apart. The contour interval is 20 ft. Point elevations are: A = 700 ft B = 740 ft C = 770 ft D = 820 ft
Types of contour maps • Topographic (terrestrial elevation) • Bathymetric (sea floor elevation) • Isohyets (rainfall) • Isopachs (rock or sediment thickness) • Isotachs (wind speed) • Isobars (air pressure) • Geopotential heights (altitude of a given air pressure)
Isobaric maps (air pressure) Individual lines are called isobars.
Isobars (solid yellow lines) This is a strong low pressure system, which produced large amounts of snow and wind across the eastern US. In an isobaric map, where isolines are close together, winds are the strongest. Winds are strongest in Virginia, North Carolina, and West Virginia.
Isotach (wind speed) Colored areas represent isotachs, lines encompassing areas of equal windspeed. Contour interval = 10 knots Green lines are geopotential heights, the altitude at which one reaches 300 mb in air pressure. For example, 9720 represents 9720 meters. 300 mb in air pressure is reached when altitude is 9720 meters or about 32,000 ft.
Geopoential heights The blue lines are geopotential heights. Contour interval is 60 meters How high would you have to go up to reach 300 mb over Kentucky? Note that the wind barbs in this map convey the direction of wind flow.
Isopach map (contour interval = 5 ft) show the thickness of rock layers or some subsurface feature. In this map they show the thickness of a rock layer known to produce oil. The round symbols are oil well locations and the depths (6000 – 7000 ft) drilled to reach oil. Why would oil drillers want to know the thickness of an oil-bearing rock layer?
Isopach map showing thickness of the limestone comprising the Florida Aquifer
Isopach map showing thickness of hydrocarbon-bearing strata in western Kentucky.
Map projections • A projection is any number of cartographic models used to project the Earth’s curved surface as a flat surface
Why don’t we just use a globe instead of flat maps? • Globes are virtually ideal models of the world: • Correct shape • Correct area • Correct distances • Correct direction
Because, globes are: • Impractical • Expensive to manufacture • Difficult to plot routes on a curved surface • Users are overhead of a single point (perspective view), not an orthographic view (directly overhead of all points) • Instead, we use:
What are the tradeoffs for projecting the globe onto a map? • A sphere is an undevelopable surface. An undevelopable surface cannot be flattened into two dimensions without some distortion.
Types of projections Cylindrical projection
Distortion from projection • Every map projection distorts at least three and sometimes all four, of the following properties: shape, area, distance, and direction • No projected maps can have both true shape (conformality) and true area (equivalence).
distortion ellipses The Mercator projection distorts area (look at Greenland), but shape is true
Cartographic scale • Map scale is the ratio of the size of an object on a map to its actual size • Map scale is expressed with a representative fraction (RF): • 1:50,000 • 1:10,000 • These can be interpreted as: 1 inch = 10,000 inch or 1 cm = 10,000 cm. Any unit can be used so long as they are on both sides of the equation.
Cartographic scale • Assuming that you have two maps of the same paper size, which of the two RFs shows the most detail and the smaller surface area? 1:50,000 • 1:10,000
Impact of cartographic scale on representation of data 1:250,000 1:50,000 1:2,500
Operational scale Spatial and temporal dimension of an object or process
Ecological scale Scale at which observations and measurements take place