Mastering Climate Graphs Easily | How-to Guide for Beginners
50 likes | 93 Vues
Learn how to draw and interpret climate graphs with ease. Explore methods to calculate annual rainfall, average temperature, and temperature range. Practice using real climate data from Leeds to create accurate climate graphs. Enhance your geography skills today!

Mastering Climate Graphs Easily | How-to Guide for Beginners
E N D
Presentation Transcript
HOW TO DRAW CLIMATE GRAPHS MARIA SANZ
How to draw a climate graph By the end of today’s lesson you will: • know how to draw a climate graph. • be able to read a climate table and graph.
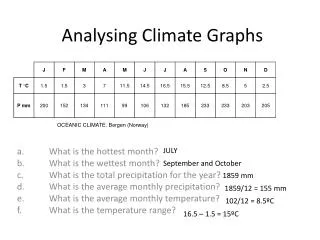
FIRST LOOK AT THE DATA AND THEN PLOT THE GRAPH The table below shows the climate data for Leeds. The average temperature in March is 6°C The average rainfall in September is 51 mm How would you calculate the total annual rainfall? How would you calculate the average annual temperature? How would you calculate the temperature range? 3
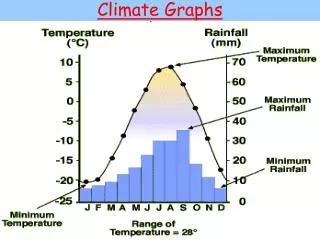
IES ANGEL CORELLA - GEOGRAPHY DEPARTMENT But how do you represent the data above in the form of a graph? The red line is the average temperature The blue bars show average rainfall 4
IES ANGEL CORELLA – GEOGRAPHY DEPARTMENT Once you have drawn a climate graph you need to be able to interpret (read) the graph. The temperature peaks in July and August with an average of 16°C. The wettest month is August when an average of 66 mm of rain falls The maximum rainfall is 66 mm and the minimum is 41 mm – a range of 25 mm. The maximum temperature is 16°C and the minimum is 3°C – a range of 13°C. The driest month is February when an average of 41 mm of rain falls. The coldest months are January and February with an average monthly temperature of 3°C. 5