Download
1 / 32
380 likes | 782 Vues
Chapter 5 Control Charts For Variables. This chapter gives an introduction to control chart methods. It gives the concepts of the method and begins by examining the control chart for variables construction and the process capability studies. Introduction. Concept of variation

E N D
Chapter 5Control Charts For Variables This chapter gives an introduction to control chart methods. It gives the concepts of the method and begins by examining the control chart for variables construction and the process capability studies.
Introduction • Concept of variation • No 2 things are alike • Variation exists - even if variation small and appears same, precision instruments show differences • Ability to measure variation necessary before can control.
Introduction Basically 3 categories of variation in piece part production (e.g. Light bulbs, washer, nuts, etc.) 1. Within piece - e.g. surface roughness 2. Piece to piece - eg. dimensions 3. Time to time - different outcomes e.g. morning & afternoon, tool wear, workers tired
Sources of variation • Many factors contribute to variation • Source of variation - combination of equipments, materials, environment, operator, etc. • Equipment - tool wear, electrical fluctuations for welding • Material - tensile strength, moisture content (e.g. raw material) • Environment - temperature, light, humidity etc. • Operator - method, SOP followed, motivation level, training • Inspection - inspector, inspection equipment, environment
Causes Of Variation - Chance & Assignable • Chance or random causes are unavoidable • As long as fluctuate in natural/expected/stable pattern of chance causes of variation which are small – it is OK • This is in ‘state of statistical control’ • When causes of variation large in magnitude; can be identified, classified as assignable causes of variation. If present, process variation is excessive (beyond expected natural variation) • ‘state of out of control’ – assignable cause • Example : Body temperature - 36.5oC ~ 37.5oC
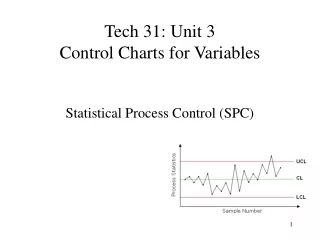
Control Chart Method • Control chart - means of visualizing variations that occur in the central tendency and dispersion of a set of observations • Graphical record of a particular quality characteristic – hardness, length, etc
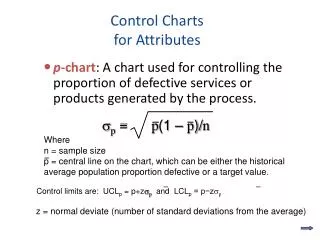
Control Chart Method • Control limits are not specification limits • CL are permissible limits of a quality characteristic • Evaluate variations in quality subgroup to subgroup • Limits established at 3 standard dev. from central line; for normal distribution – we expect 99.73% of items would lie within the limits
Objectives Of Variable Control Chart • What are the objectives ? • For quality improvement • To determine process capability • For decisions in product specifications • Provide information on production processes for current decisions • SOSC – leave alone • SOOC – investigate, solve, rectify, improve • Make decisions on recently produced items - release next process, customer or other disposition method, sorting, rework, reject
Variable Control Chart – x (average)- R chart Variable control chart – monitor measured data quality characteristic Steps • Select quality characteristic • Choose rational subgroup • Collect data • Determine trial limits and central line • Establish revised central line and control limits • Achieve the objective
Variable Control Chart – x (average)- R chart 1. Select quality characteristic • Measurable data (basic units, length, mass, time, etc.) • Affecting performance, function of product • From Pareto analysis – highest % rejects, high production costs • Impossible to control all characteristics - selective or use attributes chart
2. Choose rational subgroup • Rational subgroup - variation within the group due only to chance causes and can detect between groups changes • Two ways selecting subgroup samples • Select subgroup samples at one instant of time or as close as possible • Select period of time products are produced
Rational subgroup from homogeneous lot : same machine, same operator • Decisions on size of sample empirical judgment + relates to costs • choose n = 4 or 5 use R-chart • when n 10 use s-chart • frequency of taking subgroups often enough to detect process changes • Guideline of sample sizes/frequency using • Say, 4000 parts/day • 75 samples • if n = 4 19 subgroups • or n = 5 15 subgroups
3. Collect data • Use form or standard check sheet • Collect a minimum of 25 subgroups • Data can be vertically / horizontally arranged
4. Determine trial control limits • Calculate Central line • X = R = • X = avg. of subgroup avg. • xi = avg. of ith subgroup • g = no. of subgroups • R = avg. of subgroup ranges • Ri = range of ith subgroup • Where A2, D4, D3 are factors - vary according to different n
5. Revised Control Limits • First plot preliminary data collected using control limits & center lines established in step 4 • Use/adopt standard values, if good control i.e. no out-of-control points • If there are points out-of-control discard from data, look at records – if show an assignable cause – don’t use
Control charts with limits established • Limits for both charts become narrower after revised • Revised limits used to report / plot future sub-groups • For effective use – chart must be displayed and easily seen
Comments about CC • Some analyst eliminate the revised step - but actually more representative of process • Formula mathematically same • Initial estimate of process capability known - 6o - true Cp is next • If use specification; nominal (target) value = Xo. Range doesn’t change • Adjustments made to processes while taking data – not necessarily continue making defectives while collecting data • Process determines center line and the control limits, not design or manufacturing • When population values known easily obtained limits,
6. Achieving objective • Initiate control charts results in quality improvement • Less variation in sub-group averages • Reduction in variation of range • Can reduce frequency of inspection - monitoring purpose – even once/mth.
How Control Chart Helps In QI • Psychological effect to do better – example - maintenance group helps adjust process center • Purchasing involved in changing material supplier to ensure consistent quality • Production – standardize work methods, use/develop new tooling • Improvements must be from investigation of assignable causes (need technical back up)
Sample Std. Deviation Chart (x - s control chart ) • Both R and s measure dispersion of data • R chart - simple, only use XH (highest) and XL(lowest) • s chart - more calculation - use ALL xi’s more accurate, need calculate sub-group sample standard deviation • When n < 10 R chart s chart • n 10 - s chart better , R not accurate any more
State Of Control • When assignable causes eliminated and points plotted are within C.L.- process state of control • Further improvement through changing basic process, system • What are the characteristics of process in control? (natural pattern of variation) • 34% within 1 from Center Line • 13% between 1 & 2 • 2.5% of plotted points - 2 3 • Points located back & forth across center line random way • No points out of control
Subgroup averages forms frequency distribution which is normal distribution and limits – established at 3 from center line. • Choice of 3 is economic decision with respect to 2 types of error • Type I - occurs when looking for assignable cause but in reality chance cause present > FALSE ALARM • When limits set 3 Type I error probability = 0.27% or 3/1000 • Say point our control due to assignable but 3/1000 of the time can be due to chance cause • Type II - assume chance cause present, but in fact assignable cause present > TRUE ALARM • Records indicate 3 limits balance between 2 errors.
Process In Control • Individual parts will be more uniform – less variation and fewer rejects • Cost of inspection will decrease • Process capability easily attained • Trouble can be anticipated before it occurs • Percentage of parts fall between two values can be predicted with highest degree of accuracy, e.g. filling machines • X-R charts can be used as statistical evidence for process control
Process Out Of Control • A point falls outside control limits • assignable cause present • process producing subgroup avg. not from stable process • must be investigated, corrected • frequency distribution of
Unnatural runs of variation even within 3 limits • 7 or more points above or below center line (in a row) • 10 out of 11 points on one side • 12 out of 14 points on one side • 6 points increasing/decreasing • Z out of 3 in Zone A (WL) • 4 out of 5 in Zone B
3. For two zones 1.5 each • 2 or more points beyond 1.5
ANALYSIS FOR OUT-OF-CONTROL Patterns 1. Change/Jump in level • shift in mean • Causes - process parameters change, diff / new operator, change in raw material 2. Trend or steady change in level • drifting mean – common, upward or downward direction • tool wear, gradual change in temp. viscosity of chemical used
3. Recurring cycles • wavy, periodic high & low points • seasonal effects of mtl. • Recurring effects of temp., humidity (morning vs evening) 4. Two populations (mixture) • many points near or outside limits • due to • large difference in material quality • 2 or more machines • different test method • mtls from different supplier