Using Earned Value Analysis
Using Earned Value Analysis. Earned Value. Why Do I Need It ? What Is It ? How Do I Do It?. Today’s Situation. Need for accurate and consistent status information Numerous complex (and interrelated) projects Projects with many WBS activities Virtual offices

Using Earned Value Analysis
E N D
Presentation Transcript
Earned Value Why Do I Need It ? What Is It ? How Do I Do It?
Today’s Situation • Need for accurate and consistent status information • Numerous complex (and interrelated) projects • Projects with many WBS activities • Virtual offices • Diverse technology platforms
There’s Room For Improvement • 70% of projects are: • Over budget • Behind schedule • 52% of all projects finish at 189% of their initial budget • And some, after huge investments of time and money, are simply never complete • Source:The Standish Group
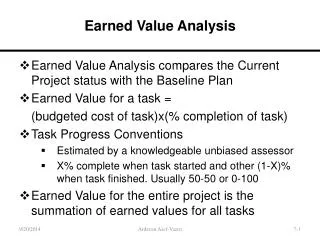
Earned Value Analysis (EVA) • “Earned Value Analysis” is: • an industry standard way to: • measure a project’s progress where direct measures cannot be used • Predict future performance, and • provide schedule and budget variances along the way • By integrating three measurements, it provides consistent, numerical indicators with which you can evaluate and compare projects.
EVA – the three elements • It compares the PLANNED amount of work with what has actually been COMPLETED, to determine if Cost, Schedule, and Work accomplished are progressing as planned. • Work is “Earned” or credited as it is completed.
Earned Value is needed because... • Provides an “Early Warning” signal for prompt corrective action. • Bad news does not age well. • Still time to recover • Timely request for additional funds
Earned Value Management EVolution • 1959 US DoD began looking at Milestone Charts and Rate of Expenditure Curves. • 1963-64 Earned Value concept begins with the ‘Minuteman’ & ‘Titan III’ rocket programmes. • 1966 USAF - Cost/Schedule Planning & Control Specification (C/SPCS). • 1967 US DoD - Cost/Schedule Control Systems Criteria (CSCS2). • 1972 US DoD - Issued the Joint Implementation Guide (JIG). (revisions were to follow 1976, 1980, 1987 and 1996). • 1972 NASA • 1975 US Dept of Environment (DoE) • 1982 US National Security Agency • 1989 Australian DoD • 1990 Canadian DoD • 1992 National Oceanic & Atmospheric Administration (NOAA) • 1994 Federal Bureau of Investigation (FBI), Inland Revenue Service (IRS) • 1996 JIG replaced by Earned Value Management Implementation Guide (EVMIG) (revised 1997) • Present World wide implementations…….USA, Europe, Canada, Australia, Japan
Traditional Plan vs. Actual view • Is there a performance problem? Is it a good or bad position?
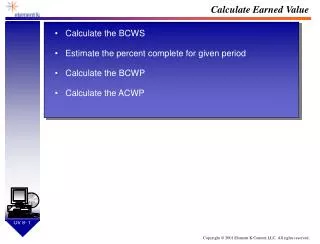
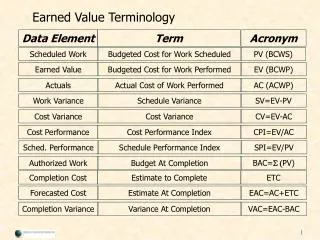
Terminology • BCWS - Budgeted Cost of Work Scheduled • ACWP - Actual Cost of Work Performed • BCWP - Budgeted Cost of Work Performed
Earned Value Definitions • BCWS:“Budgeted Cost of Work Scheduled” • The plannedearned value to be performed by the milestone date.
Earned Value Definitions (cont.) • ACWP:“Actual Cost of Work Performed” • ActualCost to date.
Earned Value Definitions (cont.) • BCWP:Budgeted Cost of Work Performed • The actual earned value i.e. the value of the work performed based on its planned value
How to construct the baseline (BCWS) (planned earned value) • Establish the activities (milestones) • Calculate a budget for each activity (milestone). What is the cost of completing the activity? • Ideally one activity (milestone) per reporting period • In a table, record the cumulative budget for each milestone and draw the graph
How to score the Earned Value (BCWP) (actual earned value) • When an activity (milestone) is achieved, the Earned Value (EV) is scored equal to its planned value • It has nothing to do with how much you get paid • The EV is scored in the period in which it was completed
How to record Actual Cost (ACWP) • Actual cost of doing the work • This may be recorded for each activity (milestone). This is the ideal situation, but you may only have information relating to actual cost for the entire project. This is also acceptable • You may be accumulating an actual cost in a period prior to the activity is delivered.
Graphical representation of project progress Budget At Completion (BAC) £ Planned Costs (BCWS) Actual Costs (ACWP) Earned Value (BCWP) Time Today
Exercise Describe the status of each project using EV terminology 10 minutes
6 examples 2. 1. £ £ BCWS BCWS BCWP ACWP ACWP BCWP Time Time Today Today As at today, the value of the work that has been completed is greater than plan, therefore we are ahead of schedule. The actual cost of work is less than plan and also less than the BCWP. Therefore we have been doing the work very much cheaper than plan. As at today, the value of the work is less than planned, therefore we are behind schedule. The actual cost of work is greater than plan and also greater than the BCWP. Therefore we have been doing the work considerably more costly than planned.
6 examples 4. 3. £ £ BCWS BCWS BCWP ACWP ACWP BCWP Time Time Today Today As at today, the value of the work is greater than planned value, therefore we are ahead of schedule. The actual cost of work is greater than plan but less than the BCWP. Therefore despite having spent more money than plan, on the work we have completed, we are doing it cheaper than the plan. As at today, the value of the work is greater than planned value, therefore we are ahead of schedule. The actual cost of work is greater than plan and also greater than the the BCWP. Therefore as well as spending more money than planned, we are overspent on the work that we have completed.
6 examples 6. 5. £ £ BCWS BCWS BCWP ACWP ACWP BCWP Time Time Today Today As at today, the value of the work is less than planned value, therefore we are behind schedule. The actual cost of work is less than plan but is greater than the BCWP. Therefore despite having spent less than the plan, on the work that we have done we are overspending As at today, the value of the work is less than planned value, therefore we are behind schedule. The actual cost of work is less than plan and also less than the BCWP. Therefore as well as being under the planned expenditure, we are also doing the work cheaper than the plan
Some Derived Metrics • SV: Schedule Variance (BCWP - BCWS) • A comparison of the amount of work performed to what was planned to be performed. • A negative variance means the project is behind schedule • CV: Cost Variance (BCWP - ACWP) • A comparison of the budgeted cost of work performed with actual cost. • A negative variance means the project is over budget.
Some More Derived Metrics • SPI: Schedule Performance Index SPI = BCWP / BCWS SPI < 1 means project is behind schedule • CPI: Cost Performance Index CPI = BCWP/ACWP CPI < 1 means project is over budget
Cost indices and variances • Cost Performance Index (CPI) = BCWP • ACWP • Cost Variance (CV) = BCWP - ACWP • Cost Variance % (CV%) = CV x 100 • BCWP • Schedule indices and variances • Schedule Variance (SV) = BCWP - BCWS • Schedule Performance Index (SPI) = BCWP • BCWS • Schedule Variance % (SV%) = SV x 100 • BCWS
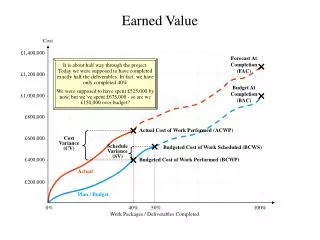
Graphical representation of project progress Budget At Completion (BAC) £ Schedule slippage (time) Planned Costs (BCWS) Cost Variance (£) Actual Costs (ACWP) Schedule Variance (£) Earned Value (BCWP) Time Today
Making Projections Once a project is 10% complete, the overrun at completion will not be less than the current overrun. Once a project is 20% complete, the CPI does not vary from its current value by more than 10%. The CPI and SPI are statistically accurate indicators of final cost results. Source: Defense Acquisition University
Estimate At Completion (EAC) • Formula 1 = BAC • CPI • Considered to give a minimum EAC • Formula 2 = BAC • CPI x SPI • Provides an EAC that accounts for a schedule change • Formula 3 = ACWP + BAC – BCWP • CPI x SPI • Provides an EAC that accounts for a schedule change, but also takes • into account the value of the work done { }
Graphical representation of project progress Estimate At Completion (EAC) Variance at Completion Budget At Completion (BAC) £ Schedule slippage (time) Planned Costs (BCWS) Forecast schedule slippage Cost Variance (£) Actual Costs (ACWP) Schedule Variance (£) Earned Value (BCWP) Time Today
Exercise 1. Read the worked example • Do the Earned Value exercise 1 hour
Now the real world! • Activities do not always last for a reporting period (week, month etc) • Some activities do not deliver anything, e.g. management support, but it still a cost to the project
Activities do not always last for a reporting period – What can be done? • Use an Earned Value Method of 50/50 • When constructing the BCWS (the plan), you put 50% of the activity (as a BCWS value) in the period the activity is planned to start and the remaining 50% in the period when the activity is planned to finish. • The BCWP (Earned Value) is earnt in the same proportions, i.e. 50% when the activity starts and 50% when the activity finishes
Some activities do not deliver anything - What can be done? • Use an Earned Value Method called Level of Effort • When constructing the BCWS (the plan), spread the activity value evenly throughout the duration • The BCWP (Earned Value) is earnt in the same proportion to the plan regardless of whether any time has been spent on the activity or not • BCWP = BCWS therefore SPI = 1.0 and SV = 0 It shows that we are always on schedule for this type of activity
EVMS / EVM / EV / EVA • Earned Value Management System: • The executive Cost and Schedule system employed • Can be a single system or many that are working together • Earned Value Management: • Active management of a programme using EV processes & EVA • Earned Value Methods: • Metric selected to provide best possible reflection of Schedule performance • Typically: 0-100, 20-80, 50-50, 40-60, Estimates, Milestones, Apportioned, & • Level of Effort • Earned Value: • Budgeted Cost of Work Performed…BCWP • Executed tasks within a baseline having been completed in line with exit criteria • Earned Value Analysis: • Variance Analysis of - Current month, Cumulative to Date, and VAC • EAC Analysis in terms of TCPI(EAC) / Independent EACs if warranted
Key EVMS Components • Authorisation • Planning & Budgeting • Baseline Change Control • Analysis • Reporting
Authorisation • Control Account Authorisation CAA: • Total Allocated Budget (TAB) flow-down to reporting WBS • Details initial Baseline distribution of Budget • Provides a narrative (and/or) points to additional documentation detailing deliverables • Indicates ‘open duration’ of Control Account • Details specific schedule adherence • Signed off by both Programme Manager and Control Account Manager • Usually a one-time event…future budget transactions being dealt with by PCR’s
Planning and Budgeting • Total Planning or Rolling Wave Planning • Vertical & Horizontal Integration with Milestones, especially if a Critical Path is required • Resource allocation and management • Management Reserve (in-scope arisings) • Undistributed Budget (WBS earmarked budget) • Earned Value Method (EVM) selection • TAB = (DB + UB + MR) • Where (DB+UB+MR) >TAB = Over Target Baseline !
Baseline Control • Baseline Change Control is performed using Programme Change Requests (PCRs) • Baseline distribution = Contract Budget Base (CBB Log) • Change Control (‘Rubber Baseline’ mitigation) performed by the usage of PCR’s • PCR’s authorise both BAC/EAC and ‘pure’ EAC changes • An understanding of MR v EAC is required ! • PCR’s are signed-off by Programme Managers
Analysis • Performance = Current Month, CTD, and Variance at Completion • History = SV, SPI, CV, CPI • Current Management Reserve level & predicted ‘Burn-Down’ • Programme flexibility = MR versus VAC delta • Staffing…..Equivalent Heads versus Forecast • Milestones….future forecasted dates versus requirements (Exec, MWP, Programmatic) • Variance Analysis Reports (VAR’s) and Corrective Actions • Future = TCPI(EAC) and Trending History
Variance Analysis Report (VAR) • Thresholds: • Fixed at Baseline • Current month SV & CV • Cumulative SV & CV • VAC • CAM reports: • Cause of variance • Impact to Cost & Schedule • Corrective Actions • VAR’s: • Discussed at MPR’s • Agreed and signed by PM/PL • Corrective Actions: • Reviewed at subsequent MPR’s
Shortcomings of Earned Value • Quantifying / measuring work progress can be difficult. • Time required for data input, data gathering and calculation • It is not the only way to manage a project
Summary • Use indicators to manage your project and not to be a goal in itself. They will drive a behaviour. • EV data is historical. Use it to predict and influence the future • Look at Indices and Variances together and observe trends • Concentrate on the parts of the project that ‘trip’ the variances • Not all projects are the same, i.e. do not expect the same sort of variances and indices on a technically challenging/risky project compared with more straight forward projects • For EVA to be effective, it requires a credible baselined plan.