Earned Value Analysis by John Cornman
Earned Value Analysis by John Cornman. Introduction. “Earned Value Analysis” is an industry standard way to measure a project’s progress, forecast its completion date and final cost, and provide schedule and budget variances along the way.

Earned Value Analysis by John Cornman
E N D
Presentation Transcript
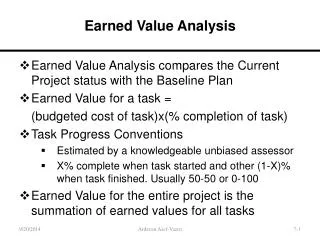
Introduction • “Earned Value Analysis” is an industry standard way to measure a project’s progress, forecast its completion date and final cost, and provide schedule and budget variances along the way. • Based on just 3 data points, it can provide consistent, numerical indicators with which you can evaluate and compare projects.
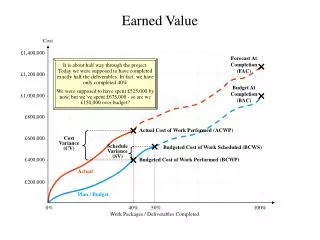
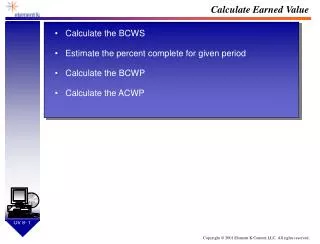
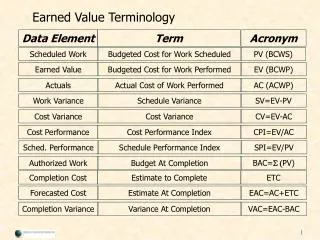
The 3 fundamental metrics • Budgeted Cost of Work Performed. • Budgeted Cost of Work Scheduled. • Actual Cost of Work Performed.
Budgeted Cost of Work Performed • This is the “Earned Value.” • Abbreviated as BCWP. • For completed work, it is the cost originally budgeted to accomplish that work. • “How much work was actually done?”
Budgeted Cost of Work Scheduled • Abbreviated BCWS. • It is the total budgeted cost up to the analysis date. • Approximated by the total budget multiplied by the fraction of total project duration at the analysis date. • “How much work should have been done?”
Actual Cost of Work Performed • Abbreviated ACWP. • What it actually cost to accomplish all the work completed as of the analysis date. • “What did the work that was actually done actually cost?”
Derived Metrics • Schedule Variance (SV) • Schedule Performance Index (SPI) • Cost Variance (CV) • Cost Performance Index (CPI)
A Few More Acronyms • BAC - Budget At Completion • = Total Original Budgeted Cost • Same as BCWS at completion • EAC - Estimate At Completion • = Cumulative Actuals + Estimate-To-Complete • VAC - Variance At Completion • = Forecast of final cost variance
Doing The Math • SV = BCWP - BCWS • Negative means Behind Schedule • SPI = BCWP / BCWS • Less than 1.00 means Behind Schedule • CV = BCWP - ACWP • Negative means Over Budget • CPI = BCWP / ACWP • Less than 1.00 means Over Budget • EAC = BAC / CPI
An Example: Lemonade • Make 1,000 cups over 50 days • Steady rate of 20 cups per day • Budgeted cost per cup is $0.50 • Total project budget is $500
Lemonade Progress • At end of day 10: • 150 cups have been made • Total actual cost is $90 (ACWP)
Lemonade Status • BCWS = $100 • 10 days x 20 cups per day x .50/cup budget • BCWP = $75 (Earned Value) • 150 cups x .50/cup budget • SV = BCWP - BCWS = -$25 • SPI = BCWP / BCWS = 0.75 • CV = BCWP - ACWP = $75 - $90 = -$15 • CPI = BCWP / ACWP = 0.833
Lemonade Forecast • EAC = BAC / CPI = $500 / 0.833 = $600 • VAC = BAC - EAC = $500 - $600 = $100 (unfavorable) • Schedule at Completion =50 / SPI = 50 / 0.75 = 66.67 days
Five Simple Criteria forEarned Value Applications 1. Define (scope) the project. . .with a WBS 2. Plan and schedule the project scope 3. Budget cost account plans to functions 4. Establish and maintain a performance baseline 5. Monitor performance and forecast final results Fleming & Hoppleman. 1996. Earned Value Management. PMI
Earned Value Management http://www.acq.osd.mil/pm/