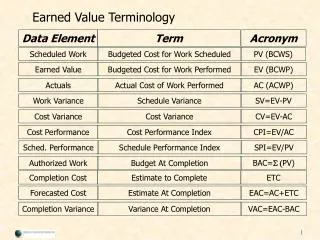
Understanding Earned Value Analysis
Understanding Earned Value Analysis. How is project health measured?. Project Manager evaluates project’s triple constraint of scope, time and cost Key Questions Is the project performing to budget? Is the project on schedule to deliver the agreed scope?

Understanding Earned Value Analysis
E N D
Presentation Transcript
How is project health measured? • Project Manager evaluates project’s triple constraint of scope, time and cost • Key Questions • Is the project performing to budget? • Is the project on schedule to deliver the agreed scope? • Typically Summarize Project Health using Green, Yellow, Red Status (Traffic Light Reporting)
Problems with the Traffic Light status approach • Subjective to interpretation and influence • No objective measurement to guide Project Health • A project can report green and suddenly turn red before a few days before the launch • A project can report red and be rationalized to green or yellow without any objective data • No prior indicators to problems
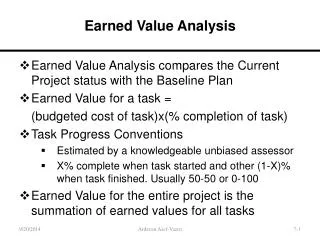
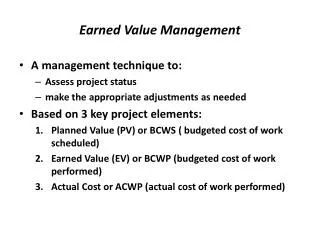
Apply Earned Value Analysis • Earned Value Analysis (EVA) • Earned Value Analysis is an objective method to measure project performance in terms of scope, time and cost • Use EVA metrics are used to measure project health and project performance
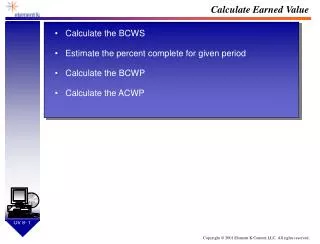
Earned Value Characteristics • Point in Time Evaluation • How much work did you PLAN to complete? (Planned Value) • How much work did you ACTUALLY complete? (Earned Value) • How much did you spend to complete the work? (Actual Cost)
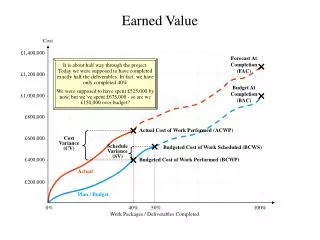
EVA Example A $10,000 software project is scheduled for 4 weeks. At the end of the third week, the project is 50% complete and the actual costs to date is $9,000 Planned Value (PV) = $7,500 Earned Value (EV) = $5,000 Actual Cost (AC) = $9,000
What is the project health? Schedule Variance = EV – PV = $5,000 – $7,500 = - $2,500 Schedule Performance Index (SPI) = EV/PV = $5,000 / $7,500 = .66 Cost Variance = EV – AC = $5,000 - $9,000 = - $4,000 Cost Performance Index (CPI) = EV/AC = $5,000 / $9,000 = .55 Objective metrics indicate the project is behind schedule and over budget. On-target projects have an SPI and CPI of 1 or greater
Forecasting Costs • If the project continues at the current performance, what is the true cost of the project? • Estimate At Complete = Budget At Complete (BAC) / CPI = $10,000 / .55 = $18,181 At the end of the project, the total project costs will be $18,181
Establish Ranges to Guide Traffic Light Status • Traffic Light status is useful in conveying overall project with one color • Establish objective SPI and CPI ranges to determine the true project color. Green [1.0 - .95] Yellow [.94-.85] Red [.84, 0]
Earned Value Summary • Earned Value is an objective method of determining project performance instead of subjective approaches • Apply Earned Value enforces the project discipline of tracking project actual performance against baseline costs and dates • Estimate at Complete calculation can forecast true project costs based on project performance