Earned Value Analysis
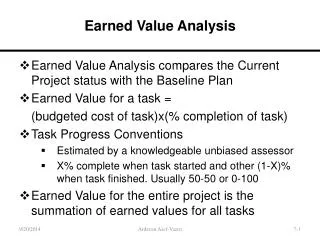
Earned Value Analysis. Earned Value Analysis compares the Current Project status with the Baseline Plan Earned Value for a task = (budgeted cost of task)x(% completion of task) Task Progress Conventions Estimated by a knowledgeable unbiased assessor

Earned Value Analysis
E N D
Presentation Transcript
Earned Value Analysis • Earned Value Analysis compares the Current Project status with the Baseline Plan • Earned Value for a task = (budgeted cost of task)x(% completion of task) • Task Progress Conventions • Estimated by a knowledgeable unbiased assessor • X% complete when task started and other (1-X)% when task finished. Usually 50-50 or 0-100 • Earned Value for the entire project is the summation of earned values for all tasks 9/20/2014 Ardavan Asef-Vaziri 7-1
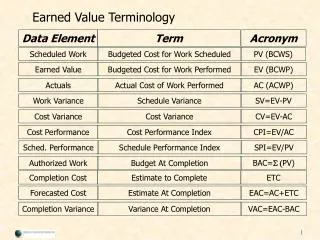
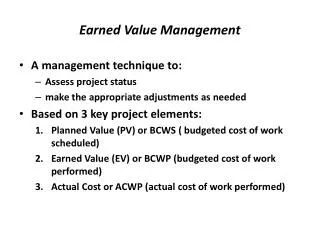
PV, EV, and AC PV: Planned Value, baseline cost of scheduled work. Also known as Budgeted Cost of Work Scheduled (BCWS) AC: Actual cost of work performed. Also shown by (ACWP) EV: Earned Value, budgeted cost of work performed. Also shown by (BCWP) 9/20/2014 Ardavan Asef-Vaziri 7-2
Control System Example 1 Week 2: Task expenses = 460 worker-hours Actual Is the task “out of control”? Planned 9/20/2014 Ardavan Asef-Vaziri 7-3
600 500 400 Worker-hours 300 200 100 0 1 2 3 4 Week Control System Example 1 Week 3: Task expenses = 500 worker-hrs Actual Planned Again, is the task “out of control”? 9/20/2014 Ardavan Asef-Vaziri 7-4
Controlling Projects • Key decisions in controlling performance in project management: • What is the optimal review frequency? • What are appropriate acceptance levels at each review stage? • “Both over-managed and under-managed development processes result in lengthy design lead time and high development costs.” • R.H. Ahmadi, R. Wang. 1999. Managing Development Risk in Product Design Processes. Operations Research 47, 235-246 9/20/2014 Ardavan Asef-Vaziri 7-5
Types of System Variation • Common cause variation: “in-control” or normal variation • Special cause variation: variation caused by forces that are outside the system • Treating common cause variation as if it were special cause variation is called “tampering” • Tampering always degrades the performance of a system – W.E. Deming 9/20/2014 Ardavan Asef-Vaziri 7-6
Performance Metrics for Example 1 PV: Planned Value, baseline cost of scheduled work. AC: Actual cost of work performed. EV: Earned Value, budgeted cost of work performed. PWC: percentage of work completed. 9/20/2014 Ardavan Asef-Vaziri 7-7
Schedule Variance Schedule variance: difference between value of work completed and value of scheduled work SV = EV – PV 9/20/2014 Ardavan Asef-Vaziri 7-8
Cost Variance Cost variance: difference between value of work completed and actual expenditures CV = EV – AC 9/20/2014 Ardavan Asef-Vaziri 7-9
Total Variance Total variance: Cost Variance–Schedule Variance =(EV-AC)-(EV-PV) TV = PV – AC 9/20/2014 Ardavan Asef-Vaziri 7-10
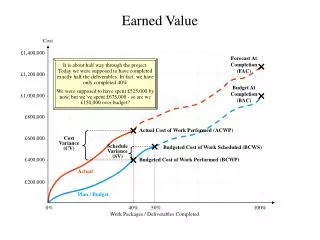
Earned Value Chart PV (baseline) Dollars AC Cost variance Actual cost Schedule variance EV Value completed (Earned Value) Now Time 9/20/2014 Ardavan Asef-Vaziri 7-11
Earned Value Chart 2 AC Dollars PV EV Time 9/20/2014 Ardavan Asef-Vaziri 7-12
Earned Value Chart 3 PV Dollars EV AC Time 9/20/2014 Ardavan Asef-Vaziri 7-13
Earned Value Chart 4 Dollars PV AC EV Time 9/20/2014 Ardavan Asef-Vaziri 7-14
Earned Value Chart 5 Dollars PV EV AC Time 9/20/2014 Ardavan Asef-Vaziri 7-15
Earned Value Chart 6 Dollars PV EV AC Time 9/20/2014 Ardavan Asef-Vaziri 7-16
Control System Example 2 Progress report at the end of week #5: Cumulative Percent of Work Completed: Worker-Hours Charged to Project: 9/20/2014 Ardavan Asef-Vaziri 7-17
Control System Example 2 9/20/2014 Ardavan Asef-Vaziri 7-18
Control System Example 2 9/20/2014 Ardavan Asef-Vaziri 7-19
Control System Example 2 9/20/2014 Ardavan Asef-Vaziri 7-20
Schedule and Cost Indices SPI: Schedule Performance Index SPI = EV / PV CPI: Cost Performance Index CPI = EV / AC 9/20/2014 Ardavan Asef-Vaziri 7-21
Budget and Estimate at Completion 9/20/2014 BAC: Budget At Completion EAC: Estimate At Completion ETC: Estimated to Completion Ardavan Asef-Vaziri 7-22
Updating Forecasts: Future is the same as actual Assumes that the progress in future is the same as actual 9/20/2014 Ardavan Asef-Vaziri 7-23
Updating Forecasts: Future is the same as schedule (Example 2) Assumes that the progress in future is the same as schedule 9/20/2014 Ardavan Asef-Vaziri 7-24
TIME To Completion: (Example 2) Assumes that the progress in future is the same as actual 9/20/2014 Tp: Project duration ETp:Estimated project duration Tnow:Elapsed time Ardavan Asef-Vaziri 7-25
Updating Forecasts: Optimistic Viewpoint (Example 2) Assumes that the progress in future is the same as schedule 9/20/2014 Ardavan Asef-Vaziri 7-26
Example 3 Budgeted cost for finished task = $850K. Actual cost to date = $550K; Task is 70% complete, but was scheduled to be 80% complete by now. The project was scheduled for 12 months. It is now end of month 10. AC = 550, PV = 0.8×850 = 680, EV = 0.7×850 = 595 Cost variance = EV – AC = +45 Schedule variance = EV – PV = -85 CPI = EV / AC = 1.082 SPI = EV / PV = 0.875 9/20/2014 Ardavan Asef-Vaziri 7-27
Example 3 BAC= 850. AC = 550; % Complete = 70%, Scheduled % Complete = 80%. Scheduled Duration = 12 months, now = end of month 10. PV = 0.8×850 = 680, EV = 0.7×850 = 595 CV = EV – AC = +45, SV = EV – PV = -85 CPI = EV / AC = 1.082, SPI = EV / PV = 0.875 Estimated Remaining Cost = 850/1.082 -550= 236 Estimated Remaining Time = Tp/0.875 –Tnow= 12/0.875-10 = 13.71-10 = 3.71 months Estimated Remaining Cost = 850-CV -AC= 850-(45) – 550 = 255 tV = Tnow - Tnow /0.875 =- 1.43 Estimated Remaining Time = Tp –tV – Tnow = = 12- (-1.43) – 10 = 3.43 months 9/20/2014 Ardavan Asef-Vaziri 7-28
Critical Ratio The critical ratio is the product of a schedule ratio and a cost ratio. Indicates when a task or process is becoming unacceptable, typically when the ratio drops below 1. 9/20/2014 9/20/2014 If both progress and budget are on the same curve, then it is Ardavan Asef-Vaziri Ardavan Asef-Vaziri 7-29
Monitoring the Critical Ratio Although Task 1 is behind schedule, the cost is correspondingly below budget so everything is fine if lateness is no problem for this activity. Task 2 is on budget but progress is lacking so too much money was spent than should have been spent; when the project is completed, it will probably go over budget. 9/20/2014 9/20/2014 Ardavan Asef-Vaziri Ardavan Asef-Vaziri 7-30
Critical Ratios With Control Limits 9/20/2014 Ardavan Asef-Vaziri 7-31
Cost Control Chart 9/20/2014 Ardavan Asef-Vaziri 7-32