COLLECTING, ORGANIZING, AND DISPLAYING DATA
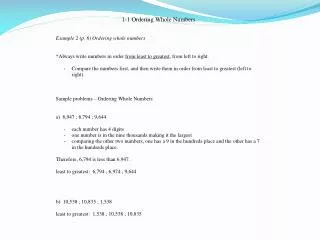
COLLECTING, ORGANIZING, AND DISPLAYING DATA. Tables Scatter plots Line graphs Pie charts Spread sheets Histograms (BAR GRAPHS) Mean, median, mode. TABLES. AVERAGE MONTHLY TEMPERATURES. WHAT CAN WE DO WITH THIS INFORMATION?. SCATTER PLOTS.

COLLECTING, ORGANIZING, AND DISPLAYING DATA
E N D
Presentation Transcript
COLLECTING, ORGANIZING, AND DISPLAYING DATA Tables Scatter plots Line graphs Pie charts Spread sheets Histograms (BAR GRAPHS) Mean, median, mode
TABLES AVERAGE MONTHLY TEMPERATURES WHAT CAN WE DO WITH THIS INFORMATION?
SCATTER PLOTS WHAT CAN WE NOTICE ABOUT THE PATTERN?
LINE GRAPHS CAN WE TELL IF THIS PERFORMANCE IS GOOD?
PIE CHARTS HOW MANY TOTAL STUDENTS SAMPLED?
HISTOGRAMSBAR GRAPHS WHAT KIND OF ANSWERS CAN WE GET FROM THIS INFO?
WE NEED A TITLE OR WE MIGHT NOT KNOW WHAT THIS IS ABOUT SPREAD SHEETS WE NEED A LEGEND OR IT MIGHT NOT MAKE ANY SENSE
MEAN, MEDIAN, MODE • MEAN – Statistics The average value of a set of numbers. • MEDIAN – Statistics The middle value in a distribution, above and below which lie an equal number of values. • MODE – Statistics The value or item occurring most frequently in a series of observations or statistical data.