
Fig. S1
Fig. S1. A. siControl E2. siER E2. siRNF31 E2. G1: 45.7% S: 26.9% G2-M: 27.4%. G1: 70.9% S: 9.9% G2-M: 19.2%. G1: 57.1% S: 12.0% G2-M: 30.9%. B. siControl. siRNF31. siRNF31+ ERα plasmid. G1: 61.7% S: 13.8%
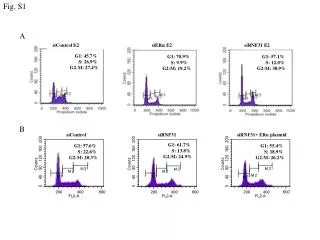

Fig. S1
E N D
Presentation Transcript
Fig. S1 A siControl E2 siER E2 siRNF31 E2 G1: 45.7% S: 26.9% G2-M: 27.4% G1: 70.9% S: 9.9% G2-M: 19.2% G1: 57.1% S: 12.0% G2-M: 30.9% B siControl siRNF31 siRNF31+ ERα plasmid G1: 61.7% S: 13.8% G2-M: 24.9% G1: 57.6% S: 22.6% G2-M: 20.3% G1: 55.4% S: 18.9% G2-M: 26.2%
Fig. S2 A MDAMB175 T47D siControl siControl siRNF31 siRNF31 120 kDa 66 kDa 37 kDa 120 kDa 66 kDa 37 kDa RNF31 ER GAPDH RNF31 ER GAPDH B RNF31 (mRNA) 1.2 1.0 0.8 0.6 0.4 0.2 0 siRNF31 SMARTpool Relative mRNA level siRNF31 oligo 1 siRNF31 oligo 2 siControl RNF31 ER GAPDH 120 kDa 66 kDa 37 kDa
Fig. S3 A B NA NA NA NA Relative mRNA level C D NA NA *** *** *** Relative luciferase activity *** *** *** Relative mRNA level Relative luciferase activity NA
Fig. S4 A IP IgG IP RNF31 B IP: RNF31 IB: ER Input IgG IP RNF31 Input IgG IP RNF31 Input IgG IP RNF31 Input IP IgG IP ER IP: ER IB: RNF31 ER Input ER ER IgG Ig G Ig G C Input IgG IP ERα Input IgG IP ERα Input IgG IP ERα RNF31 RNF31 RNF31 Ig G Ig G Ig G
Fig. S5 nucleus cytosol nucleus cytosol nucleus cytosol nucleus cytosol
Fig. S6 RNF31 ER Merge Merge with nuclear stain
Fig. S7 Fold enrichment over IgG control
Table S1 Real-time PCR primers used in this study
Table S2 RNF31 expression correlates with expression of known ERα target genes Yellow: p-value < 0.05; Red: positive correlation; Green: negative correlation


![[Fig. S1]](https://cdn3.slideserve.com/6448662/slide1-dt.jpg)


