Download
1 / 24
240 likes | 411 Vues
Tracking Ice Flow in Two Greenland Outlet Glaciers. Michael Jefferson Jr. Elizabeth City State University Research & Discover Summer 2010 Mentor: Mark Fahnestock. Objectives. To identify the best pairs of files to investigate ice flow

E N D
Tracking Ice Flow in Two Greenland Outlet Glaciers Michael Jefferson Jr. Elizabeth City State University Research & Discover Summer 2010 Mentor: Mark Fahnestock
Objectives • To identify the best pairs of files to investigate ice flow • There has to be a pair of images in order to see a change in the data • Create a new program to process the images • Gather the images and process them with the appropriate parameters • Compare findings from each of the processed image pairs
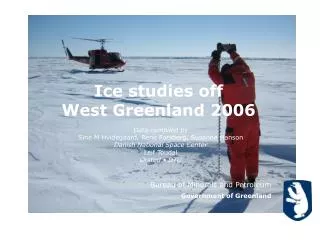
Glaciers and Remote Sensing • This satellite Landsat 7 orbits the earth and takes pictures of earth’s features • The data collected by this satellite was used in my research
Location Kangiata Nunata Sermia(KNS) • Latitude(62.4), Longitude(-49.6)
Location • Nunatakavsaup Sermia(NKS) • Latitude(74.6) ,Longitude( -56.0) • The distance was 1300 km between the two glaciers
Selecting Image files • Files where downloaded from the United States Geological Survey (USGS) GLObal VISsualization Viewer (GLOVIS) website • There were many images with too much cloud cover • If clouds cover features then the changes can not be tracked • 2004, 2005, 2007 used for KNS • 2001, 2002, 2005, 2010 used for NKS
The Program • To track features a program was used • The idea of tracking glaciers through pairs of images was developed 20 years ago • Dr. Bob Bindschalder and Dr. Ted Scambos • Dr. Mark Fahnestock wrote the program • Restrictions: Only output the changes for one iteration over a single image
The Program(Cont’d) • The program works by reading a line from a .txt file • A text file includes the two images and the geographic locations where the moving should be present
The Program cont’d Destination 50x50 Source 20x20 srcimgdel: 10 destimgdel: 25
Program Iteration • Example of a single point of an iteration • Describes the correlation over the source and destination • The closer to the color red means the more “good” unique points
Creating a New Program • The previous program only ran one set of iterations per image • Not all sections of the image had distinct features • Not all images were 100% cloud free • A new program was created to display more than one iteration on a single image Pic of one iteration
New Program: Multi-Velocity • Display multiple iterations with different parameters • Display the average velocity of the “good points” • Good points were the iteration points that had a unique correlation surface values over a specified amount
Output from New Program Green Plus- Best Correlation Red Hexagon - Worst Correlation
Results for NKS This line represents the beginning of the comparable data
20002001200220032004 20052006200720082009 2003-2005 • In years there was a large Ice front retreat this is what drove the large change in velocity over the years • Figure by: Ryan Cassotto
Results for KNS Around 1 to 1.5 Km from the ice front my data was approximately the same through the years
Conclusion • There was a large change in velocity in the northern glacier NKS during the years of 2002-2005 • There was no apparent changes in the southernmost glacier KNS
Future Work • Research more glaciers to investigate more velocity changes using satellite data • Change the program to be more efficient to run on larger collections of data
Acknowledgements • Dr. George Hurtt(Research & Discover) • Dr. Mark Fahnestock (UNH Researcher) • USGS GLOVIS (Image Database) • Ryan Cassotto(Graduate Student) • Stephen Hale(UNH Professor)