The Core Welfare Indicators Questionnaire: A CWIQ Tool for Poverty Monitoring
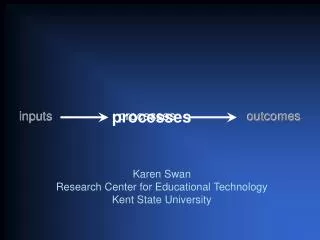
Monitor development outcomes and impact of poverty reduction strategies with CWIQ, focusing on indicators like access, usage, and satisfaction. Includes sampling, questionnaire design, quality control, data processing, and generating results. Enhance institutional capacity for data collection and analysis.

The Core Welfare Indicators Questionnaire: A CWIQ Tool for Poverty Monitoring
E N D
Presentation Transcript
The Core Welfare Indicators Questionnaire: A CWIQ Option for Monitoring Poverty Reduction Strategies
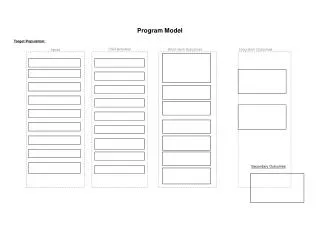
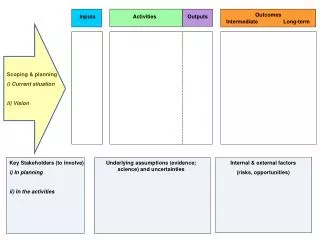
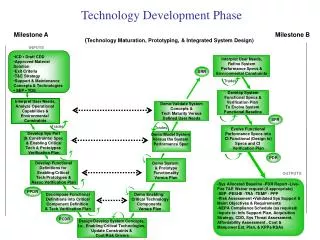
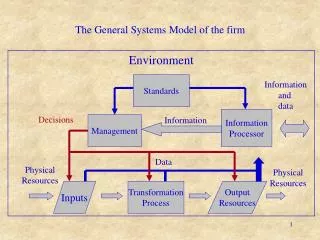
Impact Impact on living standards Who are the beneficiaries? Outcomes (access, usage & satisfaction) Goods & services generated Outputs by the project/Program Resources provided for Project/Program activities The Logframe defines M&E activities at four levels M & E Inputs
The CWIQ is a household survey It is used to monitor outcomes of development actions, (such as PRSPs) …. …..through the use of leading indicators, such as access, use and satisfaction
WARNING! % satisfied All households 40% Rural households 30% Poor rural households 18% Using CWIQ to monitor primary education in Ghana Access to schools (within 30 minutes)Usage (enrollment rates)Quality of service (% satisfied)
Lack of books a problem everywhere Poor facilities - serious problem in poor rural communities Using CWIQ to monitor primary education in Ghana What are they complaining about?
Overall more household feel they are better off now, especially among the poor Note margin of error at 95% confidence level Sample CWIQ outputs - Nigeria
Kenya (pilot) Ghana Nigeria Tanzania Lesotho Senegal Mali Rwanda CAR Guinea Bissau Mozambique Countries in which the CWIQ is planned or has been implemented
An off-the-shelf survey package Fixed core, flexible modules Simple reporting Quick data entry & validation Short questionnaire Rigorous control of data quality Large sample How does the CWIQ work?
1. Sampling issues • Large samples are encouraged • A ‘core’ survey in a 5-10 year survey program • Annual sampling from Master Sample frames builds up time series • Not really intended for panel studies - but these are not excluded • Suitable for small area sampling
2. The questionnaire • 4 pages / 9 sections • 3 levels hierarchy (household, household members, children) • Service delivery indicators (access, use and satisfaction) • Indicators on welfare status (Assets, housing, literacy, nutrition, employment)
2. The questionnaire (contd.) • The CWIQ does not collect consumption or expenditure data • The issue of poverty predictors • Kenya experience • Ghana experience • Nigeria/Mozambique experience • Rwanda experience
3. Quality control • Data quality is achieved through tight control: • thorough training; • close supervision in the field; • rapid data loading with extensive computerised validation checks; and • early feedback to interviewers in the case of problems. • Average number of interviews per enumerator/day - four • Mean interview duration - about 40 minutes (with anthropometry)
4. Data Processing - Stage 1 • RequiresTELEform for image processing of the scanned forms, converting the marked areas into data values; • Objective is to start data processing as soon as possible after the start of fieldwork. • A questionnaire can be scanned and converted into the database format in about 2 minutes. • Three people in the data processing team can handle 300 questionnaires per day. • The package includes comprehensive documentation on all aspects of the data processing.
4. Data Processing - Stage 1 How character recognition is verified and corrected using TELEform
4. Data Processing - Stage 2 • Requires Microsoft Access to build data structures, validate, correct, summarise and tabulate the data; • Once scanned the data are transferred to MS-Access which has been configured to: • perform a number of validation checks to test logical consistency of the data • provide a means of editing erroneous records • generate derived variables
5. Generating results • Pre-programmed standard report using Access and Excel • Data can be exported to standard statistical analysis packages • Data and metadata stored and disseminated on CD-ROM • Standardized indicators simplify cross-country comparisons
Summary information • It is quick! • It’s a package • Helps build institutional capacity: • to collect quality data • to speed up turnaround time • to generate annual series • TA is needed (2X6 weeks) • Duration: 2-6 months • Cost per household (approximate): • First year $54: (pilot survey on 1000 hh. costs $54,000) • Next year $33: (national survey on 10,000 hh. costs $330,000)
The CWIQ is just one of several tools needed for a poverty reduction information system • Poverty monitoring and moneymetric analysis • LSMS: Income and expenditure surveys • Poverty monitoring over time • CWIQ; Admin. records; Prices collection • Poverty monitoring and poverty maps • Censuses; small area surveys • Participative poverty monitoring (listening to the poor)
More information on the CWIQ is available at:http://www.worldbank.org/afr/stats/