Download
1 / 27
270 likes | 407 Vues
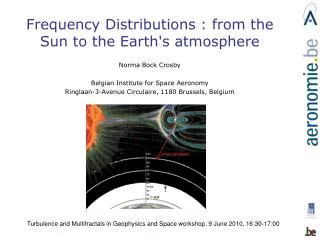
Frequency Distributions : from the Sun to the Earth's atmosphere. Self-Organised Criticality : from the Sun to the Earth's atmosphere. Norma Bock Crosby Belgian Institute for Space Aeronomy Ringlaan-3-Avenue Circulaire, 1180 Brussels, Belgium.

E N D
Frequency Distributions : from the Sun to the Earth's atmosphere Self-Organised Criticality : from the Sun to the Earth's atmosphere Norma Bock Crosby Belgian Institute for Space Aeronomy Ringlaan-3-Avenue Circulaire, 1180 Brussels, Belgium Turbulence and Multifractals in Geophysics and Space workshop, 9 June 2010, 16:30-17:00
OUTLINE • Frequency Distributions • How to interpret power-law behaviour? • - Self-Organised Criticality (SOC) • - Alternatives to SOC • Examples of power-law behaviour • - Solar data • - Magnetospheric data • - Atmospheric data • What does it all mean?
AVALANCHES Puget Sound, Washington April 29, 1965 Magnitude 6.5 Photo credit: University of California, Berkeley EVENTS ON ALL SIZES- AND TIME-SCALES Courtesy of James M. Rittner Catastrophic Events CNBC & Wall Street Journal « Many composite systems naturally evolve to a critical state in which a minor event starts a chain reaction that can affect any number of elements in the system. » Bak and Chen; 1991, Sci. Amer., 46 EIT (195 angstroms) / SOHO image of the July 14th X-class solar flare at 10:24, Courtesy of ESA/NASA
CATASTROPHIC AVALANCHES [1.] What are catastrophic events ? [2.] Are they or are they not « outliers » ? • [3.] How to study catastrophic events ? • Individual Case Studies “case by case” - often extreme events. • Statistical Studies - not possible to analyse each individual event. [4.] Does one approach teach us more than the other or do the approaches complement each other ? [5.] Are the physical processes governing the extreme events the same as those governing the average events?
When a method has been applied successfully on one part of the Sun-Earth Scenario (e.g. Sun) one can investigate if it can also be applied successfully on another part. FREQUENCY DISTRIBUTIONS • DIFFERENTIAL DISTRIBUTION • Logarithmically binned histogram • (large statistics is available, n ≥ 102, …, 103) • N(X) ~ X –α 2. CUMMULATIVE DISTRIBUTION (size of the statistical sample is small) Ncum (> X) ~ X –β~ X –(α-1)
FREQUENCY DISTRIBUTIONS • Accuracy of power-law fits: • Choice of dependent and independent parameters • Statistical uncertainty of number of events. N(X) α = slope Nele N(X) ~ X –α X1 X2 X = X2 – X1
Self-Organisation (SO) / Self-Organised Criticality (SOC) [1A. ] SO patterns are quasi-stationary (e.g. geometric patterns in galaxy formation, granulation pattern on the solar surface, ripples on sand dunes) [1B. ] SOC always involves dynamic (catastrophic) processes (e.g. solar flares, earthquakes). [2A. ] If dynamic processes are involved in the formation of SO patterns, they usually involve system-wide processes, such as diffusion, turbulence, convection, magneto-convection, which essentially operate with long-range interactions (via pressure, streams, flows). [2B.] SOC processes occur spontaneously with an explosive evolution and multiplicative growth via next-neighbour interactions. [3A.] SO patterns exhibit a close coupling over a large range. [3B.] The restriction to next-neighbour interactions in SOC processes essentially guarantees the statistical independency of individual events
Self-Organisation vs Self-Organised Criticality SO patterns can exhibit scale-free power- law distributions of spatial scales (e.g. the Kolmogorov spectrum in turbulent MHD cascades). Power-law behaviour can not be used as a distinction criterion between SO and SOC processes.Instead, the three SOC (physics-free) criteria are: Statistical Independence:Events that occur in a SOC system are statistically independent and not causally connected in space or time. Waiting time distributions should be consistent with a stationary or non-stationary Poisson process, in order to guarantee statistical independency by means of probabilities. Nonlinear Coherent Growth:Time evolution of a SOC event has an initial nonlinear growth phase after exceeding a critical threshold. The nonlinear growth of dissipated energy, or an observed signal that is approximately proportional to the energy dissipation rate, exhibits an exponential-like or multiplicative time profile for coherent processes. Random Duration of Rise Times:If a system is in a state of self-organised criticality, the rise time or duration of the coherent growth phase of an avalanche is unpredictable and thus exhibits a random duration. The randomness of rise times can be verified from their statistical distributions being consistent with binomial, Poissonian, or exponential functions.
Self-Organised Criticality • “avalanche concept” • Introduced by Per Bak et al.: • Bak, Tang and Wisenfeld; 1987, Phys. Rev. Lett., 59:381 • Bak, Tang and Wisenfeld; 1988, Phys. Rev., A38/1, 364 • Bak, Chen and Creutz; 1989, Nature, 342, 780 • Bak and Chen; 1991, Sci. Amer., 46 • Characterizes the behaviour of dissipative systems containing a “large number of elements” interacting over a short range. • There exists a local stability (Xcrit). • X>Xcritresults in a transport process. • Frequency distributions of the output (size) parameters (P) from the • chain reaction taken over a period of time can be represented • by power-laws.
Self-Organised Criticality • “applied to solar flares” • Lu and Hamilton (1991) produced a model based on SOC: • Solar coronal magnetic field is in a SOC state. • Solar flare is the response of many small reconnection events. • 3D vector magnetic (grid system) model of reconnection. • Energy release during a flare is the result of explosive magnetic reconnection. • Reconnection in a magnetized plasma will normally proceed slowly when the magnetic discontinuity angle between adjacent magnetic field vectors is less than some critical angle Parker (1988). • When a local magnetic defined gradient exceeds some threshold the 3D vector becomes unstable. “Local magnetic field is re-distributed.”
Alternatives to Self-Organised Criticality • Stochastic Relaxation Model (Rosner and Vaiana, 1978) • Flaring is a stochastic process. • Energy build-up is exponential between flares. • All the energy built-up between flares is released by the following flare. The system returns to its unperturbed “ground state” via the flare. • Forced Self-Organized Criticality (FSOC) • (Chang, 1992,1998, 1999) • An alternative concept that shares all the avalanche phenomenology (of power-law distributions), but is not necessarily self-organized. • The key aspect of this FSOC model is that some external dynamics exerts forces on a system to produce power-law like distributions of avalanches without internal self-organization. • Magnetic substorms seem to require a continuous loading process in order to drive them into a critical / near-critical state (Horton and Doxas, 1996).
SOLAR DATA Crosby, Aschwanden, Dennis, Solar Physics, 143, 275, 1993
SOLAR FLARES [HXRBS/SMM] Crosby, Aschwanden, Dennis, Solar Physics, 143, 275, 1993
SOLAR FLARES [WATCH/GRANAT] Jan.-Dec. 1990, April-Dec.1991, Jan.-April, July 1992 N(P) per cts/s Crosby N., Vilmer N., Lund N. & Sunyaev R., .; 1998, Astron. Astrophys., 334, 299 1.58 0.02 (cts/bin) Peak Count Rate (cts/s) = P UT The count rate frequency distribution of more than 5000 hard X-ray structures (less than 1 second) detected in 640 solar flares was found to be well-represented by a power-law with a slope of -1.84 (Aschwanden et al. 1995).
Peak Count Rate as a Function of Total Duration Crosby N., Vilmer N., Lund N. and Sunyaev R.; 1998, Astron. Astrophys., 334, 299 P2 T P1 • No correlation is found between the elapsed time interval between successive flares arising from the same active region and the peak intensity of the flare – provides some support to statistical flare models. • Variations of slopes in sub-group of events is observed. • “A comparison between statistical properties of solar X-ray flares and avalanche predictions in cellular automata statistical flare models”, Georgoulis M., Vilmer N. & Crosby N.B. (2001).
RADIATION BELTS from STATIC MODELS to Dynamic Behaviour (on all spatial- and time-scales) 2000 c/s Apogee: 35795 km 500 c/s Courtesy of U.S. Air Force Phillips Laboratory Sept. 1994 through March 1998 15000 c/s 5000 c/s Perigee: 200 km CID/STRV-1a (measures electrons > 750 keV)
RADIATION BELT ENHANCEMENTS 1995 1995 N(CR) per cts/s 1.476 0.007 1996 CR Count Rate (cts/s) for L= [4.1-7.7] 1997 Crosby N., Meredith N., Coates A. & Iles R. (2005) SOLAR WIND
RADIATION BELT – SOLAR WIND • Evidence for more dynamic control in the outer region of the outer radiation belt. • Entire outer radiation belt appears to be affected in the same way.
SOLAR PROTON EVENTS solar protons > 10 pfu @>10 MeV 2003 HALLOWEEN EVENT
Gabriel, S.B., and Feynman, J. (1995) - Power-law distribution for solar energetic proton events. Have we yet observed the largest SPE ? SPE data used in empirical models originate only from the satellite era. McCracken et al., (2001a and 2001b) analyzed a total of 125 large fluence SPEs identified from the nitrate deposition in ice core from Greenland for the period 1561-1950. The largest SPE in the nitrate record (associated with the Carrington white light flare event in 1859) had a >30 MeV proton fluence that was a factor 4-8 times greater than the value for the August 1972 event, which frequently is regarded as the “worst case” SPE.
Evidence for the power-law characteristics of the probability distribution of energy release events have been found in: • auroral images from Polar/UVI (Lui et al. 2000; Uritsky et al. 2002, 2003, 2006), • ** integrated energy output can be represented by a power-law with a slope -1.5 over five orders of magnitude (Uritsky et al., 2002) ** • ground-based optical auroral observations (Kozelov et al. 2004), • the burst size of the auroral electron jet index (AE) (Takalo et al. 1993; Consolini 1997, 2002), • magnetospheric substorm-related tail current disruptions (Consolini and Lui 1999). [Lui et al. 2000].
LIGHTNING Lightning is very dynamic and may show evidence for self-organizing in energy release process on many different levels, for example, the return stroke energy, the branching, and its paths. One way to investigate this is to study the impulsive VHF radiation events that occur during each step of the negative leader. Peak VHF source powers, radiated by normal lightning processes, are found to have values of about 0.1 W up to 1 MW at 60-66 MHz (Thomas et al., 2001). N. Crosby and Ron Thomas (in preparation).
SPRITES Sprites appear directly above an active thunderstorm system immediately after a positive cloud-to-ground (+CG) lightning stroke. Last from a few milliseconds to a few hundred milliseconds. Brightest region lies in the altitude range 65-75 km, above which there is often a faint red glow or wispy structure that extends to about 90 km. Below the bright red region, blue tendril-like filamentary structures often extend downward to as low as 40 km. The optical emissions observed in sprites occur in different colors of the spectrum and are most likely byproducts of the ionization and heating processes of nitrogen and oxygen. Individual events divided into: • Red at top (diffusion region) [α= -1.4013] • Blue at bottom (dendrite region, energy is more concentrated) [α= -1.7779] N. Crosby and O. Chanrion (in preparation).
WHAT DOES IT ALL MEAN ? How do the global statistics of avalanches vary for different phenomena ? - Comparable parameters are needed. Extreme Events: are they outliers or not – or are they part of the global avalanche distribution ? Does one have long enough spans of observations to cover the Extreme Events? Are the physical processes governing the extreme events the same as those governing the average events?
Frequency distribution of the energy released in some natural phenomenon (e.g. solar flares, ionospheric emissions “auroral blobs”, earthquakes) is found to be similar suggesting energy is released in some type of universal way. Compilation of frequency distributions of thermal energies from nanoflare statistics in the quiet Sun, active region transient brightenings, and hard X-ray flares [ From Aschwanden (2005)]. Does there exist a common avalanche distribution signature in the universe ?
ARE COMPLEX SYSTEMS PREDICTABLE OR NOT ? “The outstanding scientific question that needs to be addressed to guide prediction is how large-scale patterns of a catastrophic nature might evolve from a series of interactions on the smallest and increasingly larger scales, where the rules for the interactions are presumed identifiable and known.” “It is essential to realize that the long-term behaviour of these complex systems is often controlled in large part by these rare catastrophic events.” D. Sornette, PNAS, 19 Feb. 2002, vol.99, suppl. 1
IMPLEMENTING FREQUENCY DISTRIBUTIONS INTO THE ENGINEERING APPROACH – Empirical Models • Probability of extreme events (limit to the size of an event over a given time period) • Power-law distributions are increasingly being used by reinsurance companies and governments to assess the risks posed by natural hazards. Robbrecht, E., et al., “Automated LASCO CME Catalog for Solar Cycle 23: Are CMEs Scale Invariant?”, Astrophys. J., 691, 1222, 2009. • Any successful model should be ableto explain (or at least to reproduce) the results of statistical studies performed on the data.