Download
1 / 59
590 likes | 625 Vues
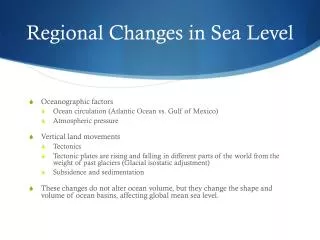
Explore research findings on sea level variations in Taiwan's surrounding seas, analyzing data quality, long-term trends, possible mechanisms, and recent trends. Gain insights into the causes and rates of sea level rise in the region.

E N D
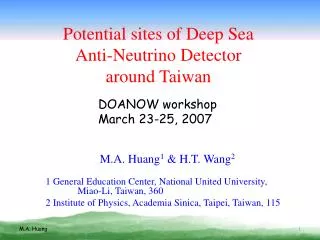
Sea Level Variations in the Marginal Seas around Taiwan Yu-Heng Tseng1, Larry Breaker2, Tsui-yu Chang 3 1國立台灣大學大氣科學系 Department of Atmospheric Sciences, National Taiwan University, Taipei, Taiwan 2Moss Landing Marine Laboratory, Moss Landing, CA, USA 3國立台灣大學海洋研究所 Institute of Oceanography, National Taiwan University, Taipei, Taiwan
Outlines • Research Background • Issuesof global sea level rise (GSLR) • SLR background studies in the vicinity of Taiwan 2. Data Analysis 3. Results • Data quality • Long term sea level rise trends around Taiwan • Rate of sea level rise • Recent sea level rise trends • Possible mechanisms (Ocean heat content, tectonic influences) 4. Summary and conclusion
1.Research Background Warming of the World Ocean Heat content (1955 to 1998) Increase by 14.5×10²²J (0-3000m) -Mean temperature increase : 0.037℃ -Global mean temp. increase from 0 to 300m : 0.171 ℃ -Warming rate : 0.2W/m2 →The Pacific Ocean has been warming since 1950s → substantial change : 0 to 300m in each ocean (the North Atlantic in depth greater than 1000m) (Levitus et al., 2000 and 2005)
1.Research Background Research Background The rate of Global Sea Level Rise(GSLR) and its cause (Enigma ) 1. What is the rate of 20th Century GSLR? 0.5-0.7mm/yr or 1.5-2.0mm/yr ? 2. What are the causes of GSLR ? Thermal expansion? Freshwater exports from continents?
Research Background 1.Research Background Cabanes et al.(2001, Science) Global mean sea level(1955-96) PSMSL GSLR seems to be overestimated!!! Miller and Douglass (2004) argued this • Steric effects: caused by volume change • Thermosteric: (temperature change) • Halosteric: (salinity change) • Eustatic effects: caused by mass change
1.Research Background Research Background Pacific region; SF,SD,HO,BB Miller and Douglas (2004) -Volume change accounts for only a fraction of SLR -1.5~2.0mm/yr for GSLR -Mass change play a dominant role
1.Research Background Research Background - A decrease in global mean salinity has occurred - This increase of freshwater causes SLR at rate of 1.3±0.5mm/yr
1.Research Background Research Background δheustatic= (ρ / Δρ )δhsteric= 36.7δhsteric=1.8mm/yr, Ocean area=3.6×10⁸km² If SLR by salinity change is known, SLR due to mass input can be calculated Eustatic rise due to mass input corresponds to 515km³/year or 1.4mm/year • 20th-century SL remains an enigma • We don’t know warming or melting was dominant
1.Research Background Research Background • Sea level Rise and Warming of the ECS and SCS • ~11.3 mm/yr (1993-2000) , -11.8 (2001-2005) in SCS (Chen and Qiu, 2007) • ~ +10mm/yr SLR rate in SCS (Li et al., 2002) • ~+2-3 mm/yr relative SLR along the coast of China (Wang, 1998) • Present study background →Interest in examining what the rate of SLR is in marginal seas around Taiwan and what the cause of SLR is? →Long-term variation? Regional v.s. global? →If it is due to warming, is it due to deep or upper water warming ?
2.Data Analysis Stations Data sources: tide gauges **WRA: Data fromWater Resources Agency, Ministry of Economic Affairs ***Final data time series is the same as the data period
2.Data Analysis Data sources: altimetry • Radar Altimeter Database System (RADS) altimetry • cross-calibrated sea level dataset from satellite altimetry, including ERS, T/P, and Geosat • Scharroo (2005)
3. Results Trend of low-latitude stations Hong Kong Kaohsiung
3. Results Trend of high-latitude stations Keelung Kanmen
3. Results ’75 ‘90 TP HK Yearly forward difference (mm/yr) XM KS -Recent sea level trend : in increasing phase from 1993 Heat anomaly Levitus Fig. 1
3. Results Unit: mm/yr IPCC AR4 (Table 5.2, 5.3)
3. Results Comparison with the global trends IPCC AR4 (Fig. 5.17) Tide gauges: Holgate and Woodworth (2004), solid black Church and White (2006), dashed black Satellite: Dazenave and Nerem (2004), green Thermal expansion: Ishii et al. (2006), solid red Antonov et al. (2005), dashed red Climate-driven land water storage Ngo-Duc et al. (2005), blue
3. Results Temperature anomaly (Ishii et al., 2006) Heat content (Levitus et al., 2005)
3. Results Satellite altimetry time series 14°C isotherm temperature anomaly (Palmer et al., 2007)
3. Results Altimetry Trend ( Absolute Sea Level ) +3.8mm/yr +2.38 mm/yr +9.3 mm/yr +8.6 mm/yr +3.17 mm/yr +3.0 mm/yr
3. Results Comparison between tide gauges and altimetry Tide gauge (KS): 4.5 mm/yr, 3.1 mm/yr Altimetry (E): 7.5 mm/yr, 3.6 mm/yr Robust linear regression LOESS ALT trend - TG trend = Vertical Land motion Temperature anomaly in northeast of SCS (Ishii et al., 2006) Correlation >0.9
3. Results Earthquake or tectonic motions Fu-Gang ( Detide ) Earthquake 2003.12.10 CK Least-Square fitting TG = Sea level measured per hour by Tidal Gauge t = Time ωi =frequency of Ocean Tide and Seasonal Signals components n = The residual values and random errors
3. Results Artificially shifting LuTao (6 years) Least-Square fitting TG = Sea level measured per hour by Tidal Gauge S = Step Function t = Time ωi =frequency of Ocean Tide and Seasonal Signals components n = The residual values and random errors
3. Results global SLR (1993-2000) Regional trend pattern around Taiwan reflects feature in the northwestern Pacific (T/P) Cabanes et al.(2001)
3. Results global SLR (TSL) ~ 0.5mm/yr (1961-2000) Cabanes et al.(2001)
Summary & Conclusion • Inhomogeneous patterns of SLR in the marginal seas around Taiwan • Mean SLR is larger than the global mean • 5.7 mm/yr v.s. 3.1 mm/yr (1993-2003), 2.4 mm/yr v.s. 1.8 mm/yr (1961-2003) • Larger SLR can be explained by larger thermal expansion locally • Reasonable agreement between ALT and TG while vertical motions may play a role in the overestimation • Decadal variations result from the coupled ocean-atmospheric climate perturbation (e.g. ENSO, PDO) • ALT data is only a part of a long-term signal
faq-5-1-fig-1.jpg Fig 5.13
Fig 5.17 Fig 5.18 Fig 5.19
Fig 5.21 Table 5.3
Vertical crust motion in eastern Taiwan derived from satellite altimetry and tide gauge records Vertical crust motion in eastern Taiwan derived from satellite altimetry and tide gauge records Vertical crust motion derived from satellite altimetry and tide gauge records
Tide Gauge( TG ) 水面上升,觀測值增加 陸地抬升,驗潮站跟著抬升,觀測值下降。
Altimetry( ALT ) 海水面的升降由衛星測得, 以參考橢球體為參基線, 故觀測值不受陸面升降影響。
ALT Absolute Sea Surface Height TG Relative Sea Surface Height ALT trend - TG trend = Vertical Land motion
3. Results Comparison between tide gauges and altimetry ALT trend - TG trend = Vertical Land motion 對於西岸的驗潮紀錄,因為各段的趨勢有很大的不同,故不用Step fuction連接前後時間序列,而選取各驗潮紀錄最後一段,估計近幾年的陸地升降趨勢。 同樣將結果圖示如左,數字的紅色代表抬藍色代表下降。
在台灣東岸的十一個測站 Tide Gauge Hourly Data for 11 Gauges Data Source: CWB
Tidal Gauge Data Correction from empirical tides Raw data Ex Cheng-Kung 利用十五個常用的潮汐週期做潮汐修正 Tide and Seasonal signal removed Least-Square fitting TG = Sea level measured per hour by Tidal Gauge t = Time ωi =frequency of Ocean Tide and Seasonal Signals components n = The residual values and random errors John Wahr, "Earth Tides", Global Earth Physics, A Handbook of Physical Constants, AGU Reference Shelf, 1, pp. 40-46, 1995.
Tidal Gauge Data Correction from empirical tides Raw data Ex Cheng-Kung Tide and Seasonal signal removed Least-Square fitting TG = Sea level measured per hour by Tidal Gauge t = Time ωi =frequency of Ocean Tide and Seasonal Signals components n = The residual values and random errors John Wahr, "Earth Tides", Global Earth Physics, A Handbook of Physical Constants, AGU Reference Shelf, 1, pp. 40-46, 1995.
在移除潮汐效應後可觀測出趨勢的大致變化情形,若有明顯的趨勢改變,則去找尋這段時間是否有地震或人為移站。在移除潮汐效應後可觀測出趨勢的大致變化情形,若有明顯的趨勢改變,則去找尋這段時間是否有地震或人為移站。 Fu-Gang ( Detide ) Earthquake 2003.12.10 CK Least-Square fitting TG = Sea level measured per hour by Tidal Gauge t = Time ωi =frequency of Ocean Tide and Seasonal Signals components n = The residual values and random errors
為了不影響本研究討論單純情況下的陸地趨勢變化,為了不影響本研究討論單純情況下的陸地趨勢變化, 故不把地震造成趨勢變動的效應納入。 Fu-Gang ( Detide ) +8.7 mm/yr -12.5 mm/yr Earthquake 2003.12.10 CK Least-Square fitting TG = Sea level measured per hour by Tidal Gauge t = Time ωi =frequency of Ocean Tide and Seasonal Signals components n = The residual values and random errors
若有明顯人為移動測站而改變基線的情況, 則使用Step function做修正把基線移為一致。 LuTao(6 years) Least-Square fitting TG = Sea level measured per hour by Tidal Gauge S = Step Function t = Time ωi =frequency of Ocean Tide and Seasonal Signals components n = The residual values and random errors
本研究使用的Along Track測高衛星,兩顆衛星前後接續相同任務,每沿著軌道每十天為一個循環。 2. Altimetry Data Source: NASA/CNES AVISO
T/P and Jason-1 10 daysRepeatAlong Track Data 衛星在台灣周圍走過的軌道
Least Square Regression ALT = Altimetry Sea Level Anomaly t = Time ωi = frequency of Seasonal Signals components The ”corr ”means the Data have removed the geophysical effect and tides. The process have been worked prior when we derived the data. 由於衛星的改正模式仍未做年週期及半年週期的修正,故仍用Least Square做季節性修正。
衛星資料在使用前要使用各種模式做改正,主要是改正電磁波在經過大氣層(電離層及對流層)時受到的擾動,以及各種潮汐效應,還有氣壓的修正。衛星資料在使用前要使用各種模式做改正,主要是改正電磁波在經過大氣層(電離層及對流層)時受到的擾動,以及各種潮汐效應,還有氣壓的修正。