Download
1 / 34
340 likes | 450 Vues
This document highlights significant findings regarding the Arctic climate, focusing on sea ice concentration and the impacts of CO2 doubling. It discusses simulations predicting up to an 80% decrease in summer ice by 2085 and outlines the role of Arctic ROOS in monitoring these changes. Key data are presented on temperature variations and ice extent from 1979 to 2008, based on satellite observations and climate models. The urgent need to understand these dynamics is emphasized, as summer sea ice may disappear by 2050 due to rising CO2 levels.

E N D
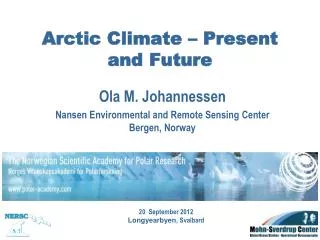
Arctic Climate – Present and Future Ola M. Johannessen Nansen Environmental and Remote Sensing Center Bergen, Norway 20 September 2012 Longyearbyen, Svalbard
Climate-model simulation of ice concentration due to CO2 doubling Sea ice: Winter 20% decrease 2085 2005 Summer 80% decrease 2085 2005 Ice concentration Johannessen et al. 2004
Gao, … , Johannessen, 2009 The simulated surface circulation between 1970 and 2000
Gao, … , Johannessen, 2009 The simulated surface circulation between 2050 and 2080 under the global warming senario
Temperature Johannessen et al. 2004
Annual temperature/ice extent 70-90oN annual SAT Modified from Johannessen et al. 2004
What is Arctic ROOS ? An association of 16 member institutions from 9 European countries with the aim to foster and develop Arctic components of Global Ocean Observing System • The background document was produced in 2005 by the EuroGOOS Arctic Task Team • Arctic ROOS is a contribution to the IPY project no. 379: "IPY Operational Oceanography for the Arctic Ocean and adjacent seas" coordinated by Prof. Ola M. Johannessen, endorsed by IPY 2006. • Arctic ROOS was established in December 2007 at the foundation meeting in Luleå, hosted by EuroGOOS and SMHI • S. Sandven from Nansen Center in Norway was elected chair and hosts the secretariat of Arctic ROOS http://arctic-roos.org/
Monitoring ice concentration from microwave satellites TOTAL ICE COVER = MULTI-YEAR ICE + FIRST-YEAR ICE 100% 90% 80% 70% 60% 50% 40% 30% 15% water land http://arctic-roos.org/
Arctic Sea Ice Area: yearly 1979 - 2008 Johannessen and Ivanova2011 (unpublished)
Cryosat-2 Launched – April 2010;Altitude - 717 km ; Inclination - 92 deg; Repeat cycles - 369 days with 30 day sub-cycle SIRAL – SAR/Interferometric Radar Altimeter (13.6 ГГц) Resolution 250 х 7 000 m CryoSat-2 is orbiting Earth at an unusually high inclination, reaching latitudes of 88° north and south.
Cryosat-2 ice thickness map The sea-ice thickness map for January and February 2011 shows thicker, rough, multi-year ice north of Canada and Greenland, stretching to the North Pole. Elsewhere in the Arctic the map reveals thinner, first year ice.
a b c a) Location of 689 ice thickness and freeboard measurements during the Sever aircraft landings on the Arctic sea ice in 1980s, where colors indicate thickness of level ice on runways; b) histogram of ice thickness on level ice (on runway) and on characteristic ice types around the landing sites (off runway), c) a scatterplot of ice thickness versus ice freeboard measurements on level ice. Alexandrov, …., Johannessen2010
Arctic Sept Sea Ice Extent Red: observed Black: model esemble Stroeve et al. 2007
All six models show rapid decline in the ice extent and reach ice-free summer before the end of the 21st century Wang and Overland, 2009
Annual Sea Ice Extent Green: observed, black: modeled, blue: B1, red: A2, shading +/- 1 s.d. Johannessen AOSL, 2008
Conclusions • Summer ice may disappear when CO2 concentration is 500ppmv • Today the CO2 concentration is increasing with 2.5 ppmv pr. year • If this increase continues the summer ice will disappear in about 40 years, ie in 2050