
Uploaded by
kateb
2 SLIDES
82 VUES
20LIKES
Exploring Plant Growth Responses to BPS1 and GFP in Quantitative Figures
DESCRIPTION
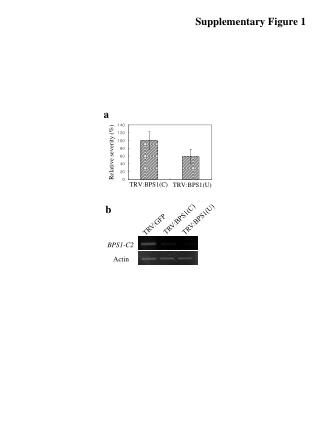
This supplementary figure demonstrates the impact of BPS1 and GFP on plant growth and actin dynamics, showing relative severity and height changes in different conditions.
Download
1 / 2
Télécharger la présentation 
Exploring Plant Growth Responses to BPS1 and GFP in Quantitative Figures
An Image/Link below is provided (as is) to download presentation
Download Policy: Content on the Website is provided to you AS IS for your information and personal use and may not be sold / licensed / shared on other websites without getting consent from its author.
Content is provided to you AS IS for your information and personal use only.
Download presentation by click this link.
While downloading, if for some reason you are not able to download a presentation, the publisher may have deleted the file from their server.
During download, if you can't get a presentation, the file might be deleted by the publisher.
E N D
Presentation Transcript
Supplementary Figure 1 a Relative severity (%) TRV:BPS1(C) TRV:BPS1(U) b TRV:BPS1(C) TRV:BPS1(U) TRV:GFP BPS1-C2 Actin
TRV:GFP TRV:BPS1(C) TRV:BPS1(U) Relative height (%) Supplementary Figure 2 a TRV:BPS1(U) TRV:BPS1(C) TRV:GFP FL 0 μM 0.1 μM 10 μM b


More Related
Audio
Live Player