
Uploaded by
katima
5 SLIDES
173 VUES
50LIKES
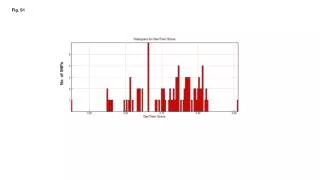
Analysis of Experimental Data: Figures S1-S5 with Statistical Significance at p < 0.05
DESCRIPTION
This document presents a comprehensive analysis of the experimental findings, illustrated through Figures S1 to S5. Each figure depicts key results and patterns within the data, highlighting significant correlations and trends. Statistical significance is established with a threshold of p < 0.05, indicating reliable results. The analysis aims to provide insights into the underlying biological or chemical processes observed in the experiments. Detailed interpretations and implications of these findings are discussed for further understanding in the relevant scientific domain.
Download
1 / 5
Télécharger la présentation 
Analysis of Experimental Data: Figures S1-S5 with Statistical Significance at p < 0.05
An Image/Link below is provided (as is) to download presentation
Download Policy: Content on the Website is provided to you AS IS for your information and personal use and may not be sold / licensed / shared on other websites without getting consent from its author.
Content is provided to you AS IS for your information and personal use only.
Download presentation by click this link.
While downloading, if for some reason you are not able to download a presentation, the publisher may have deleted the file from their server.
During download, if you can't get a presentation, the file might be deleted by the publisher.
E N D


![[Fig. S1]](https://cdn3.slideserve.com/6448662/slide1-dt.jpg)


More Related