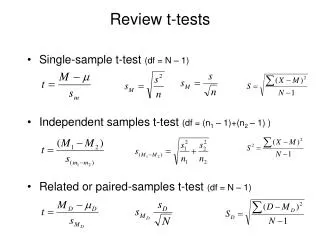
Understanding t-Tests: Introduction, Analysis, and Interpretation
Learn about the history and application of t-tests, a statistical tool introduced in 1908 by William Sealy Gosset. Discover how to use t-tests for comparing means, paired sample analysis, and hypothesis testing in Excel.

Understanding t-Tests: Introduction, Analysis, and Interpretation
E N D
Presentation Transcript
History (from Wikipedia) • Introduced in 1908 by William Sealy Gosset, a chemist working for the Guinnessbrewery in Dublin, Ireland ("Student" was his pen name because his employer regarded their use of statistics as a trade secret). Gosset had been hired due to Claude Guinness's innovative policy of recruiting the best graduates from Oxford and Cambridge to apply biochemistry andstatistics to Guinness' industrial processes.[2]Gosset devised the t-test as a way to cheaply monitor the quality of stout.
Usage Used to answer these questions: • Are two data sets “equivalent”? • Is the experiment repeatable? • In other words --- allows us to compare TWO MEANS.
My First t-Test • Is the modulus of the iris different in the axial direction from the circumferential direction? • Yes
Requirements • The t-test, equal variance requires that the errors associated with your data are normally distributed, and the two samples are independent (i.e., “unpaired”). • Before-and-after testing (e.g., experimental drug) violates the independence requirement. Need a t-test for “paired” samples. Pairing can also happen through the use of additional variable (e.g., gender) • The equal variance that is part of the test name (t-test, equal variance) implies that the variance in the population(s) behind the samples is equal.
Example Set 1: Similar Set 2: Dissimilar 1a 1b 2a 2b 5.101 4.064 4.064 3.243 5.316 6.170 6.170 2.950 5.920 5.948 5.948 3.815 6.563 5.818 5.818 2.738 4.727 4.871 4.871 3.070 4.334 5.900 5.900 2.316 2.759 5.951 5.951 2.903 mean: 4.960 5.532 5.532 3.005 std. dev.: 1.220 0.770 0.770 0.461
Hypothesis: • The t-test described here is a statistical test of these competing hypotheses: • H1 (Test Hypothesis): The population means behind the two samples are different. • H0 (Null Hypothesis): The population means behind the two samples are the same. • A t-test is any statistical hypothesis test in which the test statistic follows a Student's t distribution if the null hypothesis is true.
In Excel… • Excel 2007: Data tab / Analysis Group / Data Analysis button • Choose t-Test: Two-Sample Assuming Equal Variance
Inputting… • We “hypothesize” that the means are the same (Null hypothesis) and asking for 95% confidence.
Output… • The important value is the two-tailed P-value.
What can we say? • Ptwo-tail = 0.315173. Since this is greater than α = 0.05, we fail to reject the null hypothesis (they are the same) and can say: • we cannot conclude that the population means are different (with 95% confidence) • we cannot conclude that the samples are not “equivalent” • we cannot conclude that the experiment is not repeatable That is as close as we can come to saying the two samples are “equivalent” based on a t-test.
N.B. (Note Well!) • “we fail to reject the null hypothesis” …is not the same as… • “we accept the null hypothesis that they are the same”! • Informally, if P > 0.05, we say things like “the means are likely the same”, but this is not precisely correct.
Second (dissimilar) data set… • Ptwo-tail = 7.79x10⁻⁶. Since this is less than α = 0.05, we reject the null hypothesis and can say: • the population means behind the two samples are different (with greater than 95% confidence) • the samples are not “equivalent” • the experiment is not repeatable
Picture Mean does not fall within the tails of the other distribution
Picture Mean falls within the tails of the other distribution
Informally… • We have two different sets of data…e.g., blood pressure for 20 people on a drug and 20 people on sugar pills. • If P < 0.05 we say the differences are significant, and • If P > 0.05 we say they are insignificant. • Alas, we live in a world where no one cares if two means are the same or just slightly different. In other words, informally, “fail to reject” becomes “accept”.
Warning • If the P value > 0.05, we fail to reject the Null hypothesis, so we can say • “we could not conclude that the population means are different”, • “we could not conclude that the new data is not consistent with the published value”, or • “the experimental mean is not significantly different from the published value” • WE SHOULD NOT SAY: “we conclude that the experimental value agrees with the published value”, but many people do say this.
Notes • Some students perform a t-test and include all three statements (bullet items) in their report. Don’t do that – pick the one statement that fits with your report. • The “one-tail” P values are used for “less-than” or “greater-than” t-tests.
One-sided t-Test • Calculated by the same process in Excel. • For a one-sided t-test, the hypotheses being tested are: • H0 (Null Hypothesis) – the population means μ1 and μ2 are equal • HA (Alternate (or test) Hypothesis) – the population mean μ1 is less than population mean μ2 • Because of the “less than” comparison, you have to be careful which data set you call group 1 and which you call group 2.
One-sided t-Test • In general a test is called two-sided or two-tailed if the null hypothesis is rejected for values of the test statistic falling into either tail of its sampling distribution, and it is called one-sided or one-tailed if the null hypothesis is rejected only for values of the test statistic falling into one specified tail of its sampling distribution
Question • Should the one-tail P-value or the two-tail P-value be smaller?
Question • Should the one-tail P-value or the two-tail P-value be smaller? • One tail because you are only comparing values in one-direction (i.e., one-tail). • You’re simply comparing whether two means are equal or one is less than the other --- never consider if one value is greater than the other in the one-tail test.
t-Test, unequal variance • A t-test can be performed to see if the population means behind two data sets (samples) are similar enough to conclude that they could have come from the same population. One of those data sets might have a mean value with zero standard deviation – that is, it might be a constant.
t-Test, unequal variance • This t-test is used to answer this question: Is my experimental result “equivalent to” (or “consistent with”) a published value? • …informally • Requires: the errors associated with your data are normally distributed, and the two samples are independent (unpaired).
Hypotheses • H1 (Test Hypothesis): The population means behind the two samples are different – implying that the new data is inconsistent with the published value being tested. • H0 (Null Hypothesis): The population means behind the two samples are the same – implying that the new data is consistent with the published value being tested.
Excel results… • we could not conclude that the new data is not consistent with the published value of 43% • Most engineers would say that the new data supports the published value of 43% efficiency.
Different published value… • the new data is not consistent with the published value of 49%
Final comment • Saying that the new data is “consistent” with the published result of 43% efficiency does not mean that the new data is inconsistent with every other value. In fact, the new data shown in Table 1 is consistent with efficiencies ranging from 43% to 47%. • t-Tests are “simpler” for saying two things are different than for saying two means are the same.
References • 2 biggest mistakes… • Failing to reference statements/claims that are not common knowledge. Cite anything you (or another student) look up. • Putting references in footnotes (is it 1980?). • Put references inline with a complete list at the end. • Example: “… [1]”, numbered reference • Example: “… (Lamport, 1994)”, author-date • Example: “… (Lamport, p. 18)”, author-page
Reference List Grose, T. K. and J.A. Doe, “Engineering their Way to the Top,” ASEE Prism 12 (September 2002), p. 20. • List all authors with initials (list only first author in the inline citation).
Reference List Grose, T. K. and J.A. Doe, “Engineering their Way to the Top,” ASEE Prism 12 (September 2002), p. 20. • Article or chapter title in quotes
Reference List Grose, T. K. and J.A. Doe, “Engineering their Way to the Top,” ASEE Prism 12 (September 2002), p. 20. • Book or journal title in italic
Reference List Grose, T. K. and J.A. Doe, “Engineering their Way to the Top,” ASEE Prism,12(1), 2002, p. 20. • Volume, issue (if available), year, pages
References • Other examples… Grose, T. K. and J.A. Doe, “Engineering their Way to the Top,” ASEE Prism 12(1), 2002, p. 20. Hibbeler, R. C., Engineering Mechanics. Statics & Dynamics, 9th ed., Prentice-Hall, Inc., Upper Saddle River, New Jersey, 2001, p. 82. Sir Winston Churchill, Quotes and Stories (no date), Retrieved March 30, 2003, from http://www.winstonchurchill.org/index.html. Turabian, K. L., J.B. Smith, and J.A. Doe, A Manual for Writers of Term Papers, Theses, and Dissertations, 5th ed., The University of Chicago Press, Chicago, Illinois, 1987, pp. 127-144. • I often move the (date) after the authors. • The INFO pack uses a slight variation • Any option is fine, be consistent and complete