Download
1 / 1
10 likes | 87 Vues
Chromatin from cortical neurons was immunoprecipitated with antibodies (E2F1-5) to detect B-Myb promoter occupancy. PCR was used to verify the presence of the promoter sequence. The study provides insights into E2F regulation of B-Myb expression.

E N D
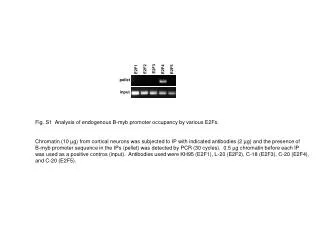
E2F3 E2F2 E2F1 E2F4 E2F5 pellet input Fig. S1 Analysis of endogenous B-myb promoter occupancy by various E2Fs. Chromatin (10 µg) from cortical neurons was subjected to IP with indicated antibodies (2 µg) and the presence of B-myb promoter sequence in the IPs (pellet) was detected by PCR (30 cycles). 0.5 µg chromatin before each IP was used as a positive contros (input). Antibodies used were KH95 (E2F1), L-20 (E2F2), C-18 (E2F3), C-20 (E2F4), and C-20 (E2F5).


![[Fig. S1]](https://cdn3.slideserve.com/6448662/slide1-dt.jpg)


