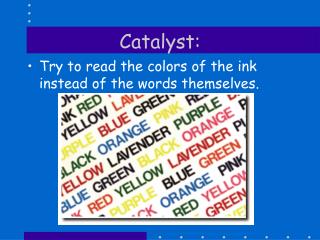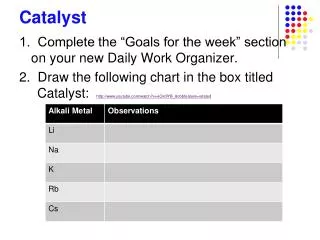
Catalyst
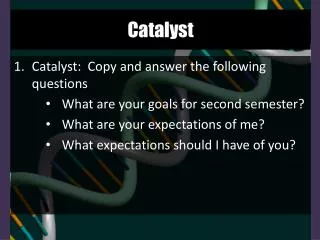
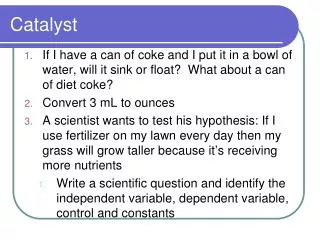
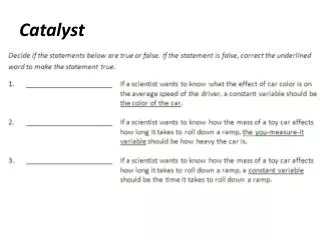
Catalyst. 1. What are the three components that go into every hypothesis? HINT: If […], then […] because […]. 2. What are three parts of the experiment step in the scientific method?. tasks.

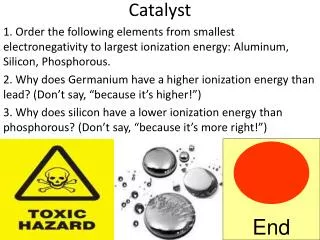
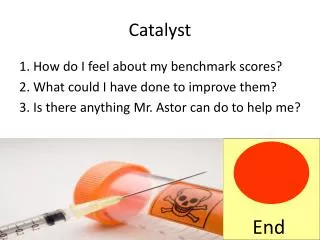
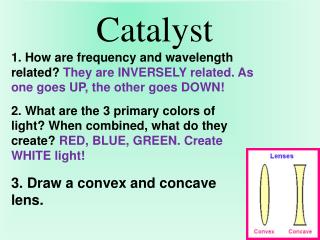
Catalyst
E N D
Presentation Transcript
Catalyst 1. What are the three components that go into every hypothesis? HINT: If […], then […] because […]. 2. What are three parts of the experiment step in the scientific method?
tasks • You will turn-in a separate sheet of paper with your answers to the questions/excercises that are embedded in this Powerpoint • Take Cornell notes on Writing a Lab Report and Designing an Experiment
OBJECTIVE By the end of today, you will be able to design an experiment and submit a lab report. Today you will plan out your experiment and write up
STEP 1: ASK AQUESTION = research question • Choose a topic that interests you! • KYSS – Keep Your Science Simple • Pick a question that is clearly stated, straight forward, and narrow • Bad example: How does heat affect different liquids? • Bad example: Which do people like better, rap or rock? • Good example: Which material is the best insulator, air, cotton, or water? • Good example: What concentration of alcohol is needed to kill 50% of germs on a surface?
EXERCISE: ADJUST THE QUESTION • Adjust these questions so that they are • more appropriate for a scientific experiment: • 1. How does heat affect different liquids? • Which do people like better, rap or rock music?
STEP 2: BACKGROUND • Research your topic to learn as much about it as you can • Describe any background information and/or formulas that are relevant to the experiment • You should have at least 3 sources of written information on your topic NOT Sources: Wikipedia These are the sources
At least 3 sourcesPURPOSE • Validate what you’re stating • Enhance the scientific content that applies to your experiment (such as explaining key terms/concepts) • Interesting tid-bits or facts that apply to your experiment • Cannot be used for common knowledge
Documentation! • Maintain a notes-page for your background research • Notes should be identified by the SOURCE (website, author, date retrieved) • Incorporate your notes as in-text citations into your narrative • Create a bibliography (Works Cited, References List)
Please refer to your glue-in for in-text citations and reference list
Step 3: Plan Effectively • Plan out the purpose of your experiment and visualize how you will perform it • Should be able to gather all materials and safely perform the experiment • Your hypothesis must answer your research question Variables • Independent Variable should be easy to change • Dependent Variable should be measured by a quantity such as count, length, percentage, time, etc. • Control Variables should be easy to control
Good Example: Plan Effectively Which paper towel brand is the strongest, Bounty, Brawny, or Viva? If I test the strength of different paper towel brands by seeing how much weight they can hold, then Bounty will be able to hold the most weight because it is the most expensive. IV: Paper towel brand DV: Amount of weight (in grams) held CV: dryness of paper towels, number of sheets, type of weights used, no wind
Exercise: Plan Effectively Create an effective hypothesis, independent variable, dependent variable, and control variables for the following question: Does age affect human reaction time?
Step 4: Prepare • Gather all materials • Write detailed, step-by-step procedures that anyone can follow • DESIGN your data table(s): make sure that you’re ready for data collection: please refer to your glue-in “Making a Data Table”
Step 5: Experiment! • Document all data and important observations • Plan ahead - take photos!
Step 6: Analyze • Create a graph/chart to display your findings. • T.A.L.K.S. • Title (dependent and independent variables) • Axes (x= independent variable & y= dependent variable) • Labels (unit of measurement in parentheses) • Key • Scale • Analysis paragraph should include the following: • Mention the significant data points • Discuss the trend(s)
EXERCISE: answer the following questions • Why was a line graph used? • What is the dependent variable? • What is the independent variable? • What is the unit of measurement and which axis is it on? • Mention the significant data points. • Discuss the trend(s).
Step 6: Analyze and Conclude • As soon as you’re done, ask yourself: “What happened?” • Do your results agree with your hypothesis? • Create a graph/chart to display your findings.
Step 7: Write your Report, Create your Display, and Rehearse.
Be Creative and Have Fun! • You can test ANYTHING you want! As long as you follow these guidelines for the experiment, you can’t go wrong! • Judges will always appreciate thinking outside the box [video]
Exercise: Sample Evaluation Using your guidelines, evaluate the sample science fair proposal provided to your table based on the following criteria: 4-Exceeds 3-Meets 2-Approaching 1-Fail
Turn-in your answers to the teacher. Make sure that your name, #, and date are on the paper! • Number your INB notes pages • Write the next page number on the appropriate right-side page of your INB