
Effects of Hypoxia on Nur77 Expression in Colon Cancer Cells
This study investigates how hypoxic conditions influence mRNA and protein levels of Nur77 in colon cancer cells. The cells were subjected to 1% O2 levels or treated with cobalt chloride (CoCl2) or desferrioxamine (DFX) to mimic hypoxia. Total RNA and proteins were extracted for RT-PCR and Western blot analysis, respectively. Immunoblots were quantified by densitometry, normalized with β-actin, and statistically analyzed. The results suggest a correlation between hypoxia and Nur77 expression in colon cancer cells.

Effects of Hypoxia on Nur77 Expression in Colon Cancer Cells
E N D
Presentation Transcript
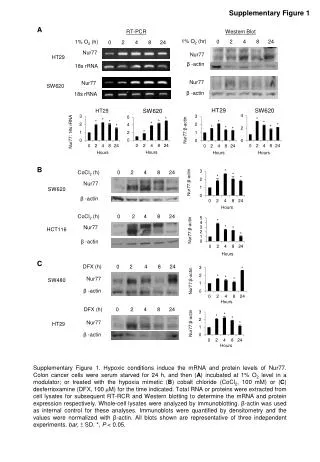
Supplementary Figure 1 A RT-PCR Western Blot 1% O2 (hr) 0 2 4 8 24 1% O2 (h) 0 2 4 8 24 Nur77 Nur77 HT29 β -actin 18s rRNA SW620 HT29 * * * * * * * * HT29 SW620 Nur77 Nur77 SW620 B * * * β -actin * * * 18s rRNA * * * * * * SW620 CoCl2 (h) 0 2 4 8 24 * * * HCT116 * * C CoCl2 (h) 0 2 4 8 24 DFX (h) 0 2 4 8 24 * * * Nur77 Nur77 SW480 β -actin β -actin DFX (h) 0 2 4 8 24 Nur77 * * * Nur77 * HT29 β -actin β -actin Supplementary Figure 1. Hypoxic conditions induce the mRNA and protein levels of Nur77. Colon cancer cells were serum starved for 24 h, and then (A) incubated at 1% O2 level in a modulator; or treated with the hypoxia mimetic (B) cobalt chloride (CoCl2, 100 mM) or (C) desferrioxamine (DFX, 100 mM) for the time indicated. Total RNA or proteins were extracted from cell lysates for subsequent RT-RCR and Western blotting to determine the mRNA and protein expression respectively. Whole-cell lysates were analyzed by immunoblotting. β-actin was used as internal control for these analyses. Immunoblots were quantified by densitometry and the values were normalized with β-actin. All blots shown are representative of three independent experiments. bar, ± SD. *, P < 0.05.


