Surface Analysis
Surface Analysis. Surface interface controls many aspects of chemistry Catalysts Corrosion Thin films Surfaces Methods. Surface. Boundary between solid and other phase Gas, vacuum, liquid Surface differs from solid bulk.


Surface Analysis
E N D
Presentation Transcript
Surface Analysis • Surface interface controls many aspects of chemistry • Catalysts • Corrosion • Thin films • Surfaces • Methods
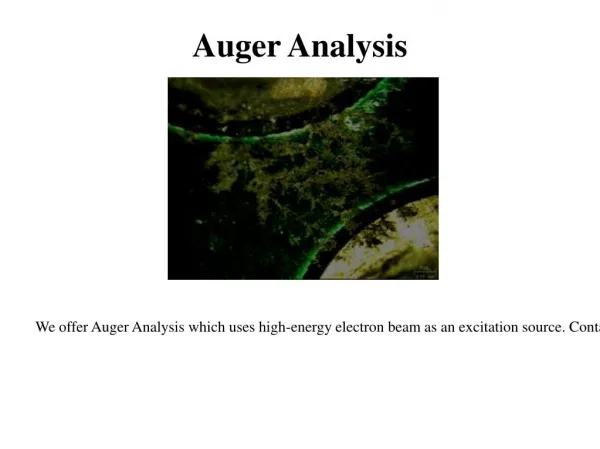
Surface • Boundary between solid and other phase • Gas, vacuum, liquid • Surface differs from solid bulk Decarburised surface layer on the seal rim. Preferential grain boundary oxidation evident
Spectroscopic Surface Methods • Incident beam and secondary beam • Photons, electrons • Incident particle not same as secondary
X-ray photoelectron spectroscopy • Examination of surface with x-rays and measurement of electrons • Evaluation of elements on surface by x-rays and Auger • A+g->A+*+e- • Electron energy (Ek) is measured • Eb=g-Ek-w • w is work function
XPS • The momentum p of the outgoing electron is determined from the kinetic energy
XPS spectra • Chemical shifts can be observed • Variation with oxidation state • Substituant groups
Auger Electron Spectroscopy • A+e1-->A+*+e1-’+eA- • Relaxation can occur in two ways • A+* => A++ + eA- • eA- = Auger electron • A+* => A+ + gf Auger emission types • KLL • LMM • MNN • Removal, transition to removed state, ejection of electron • favored by low atomic number elements hnf => fluorescence photon
Final Product Ceramic Synthesis Dried at 90°C • Calcination, Reduction, Sintering Precipitate-acetone mix from Zr, Th, U salts with NH4OH ≈5 g total salt Similar to other procedures for fuel preparation
Ceramic Synthesis Parameters • Use of H2 and reduction step examined • Calcination • Performed in air at 750 oC for one hour • Reduction • One hour at 600 oC under Ar/4% H2 • Powders placed in 5 mm die and cold pressed at 55 MPa for 1-2 minutes • Low pressure, higher surface area • Not to standard fuel surface areas • Sintering • Performed in air or Ar/4% H2(g) at 1500 oC for 4 hours
Ceramic Characterization • EDX (Energy Dispersive X-ray) (e-) • Emission of characteristic X-rays • XRD (X-ray diffraction) (g) • EELS (Electron Energy Loss Spectroscopy) (e-) • Loss of energy by monoenergetic e- • Can be used to determine oxidation state • 3d3/2 -> 5f5/2 (M4) and 3d5/2 -> 5f7/2 (M5) ratio • Based on lanthanides • XANES/EXAFS (g) • Oxidation state and near neighbor chemistry
0.5m 0.5m U Zr TEM Picture Th Mg 0.5m 0.5m 0.5m EDX Results Element bright in EDX mapping • Two phases found • Low mutual solubility of Zr and Th • Zr rich and Th rich phase • Little solubility of Th in Zr • U and Mg distributed throughout the ceramic
XRD Results: Standards U3O8 ThO2 UO2
Influence of synthesis conditions Zr6Th3UO20 Calcined in air/No reduction Calcined in air/Reduction No effect on the inclusion of reduction step: U as U(IV)
XRD Results • U is reduced to the tetravalent state in Zr-Th-U ceramic • Th and Zr stabilize tetravalent U • Calcine in air, no reduction step, sinter under Ar/4% H2 • Zr-U ceramic requires reduction step • Calcination performed under reducing conditions • more U incorporated into the ZrO2 lattice structure • Unit Cell Measured for Th3UO8 • 5.57+0.01 Å
Th-U solid solution cell parameters Black points from Hubert et al (2001)
EELS Spectra ZrTh3UO10
EELS analysis • Evaluation of U oxidation state • Multiple analysis of samples • Evaluation of M4/M5 ratio for U • UO2: 0.41±0.03 • U3O8: 0.48±0.04 • Th3UO8: 0.40±0.03 • ZrTh3UO10: 0.40±0.03 • Tetravalent U for above samples • U oxidation with higher Zr is noted in some samples • Air ingress into furnace
X-ray Absorption Spectroscopy • Utilizes x-rays from synchrotron source to probe local structure • High intensity, broad spectral range • Spectra can be separated into regions containing different information • Global technique • yields average structure of sample
XANES Spectroscopy • X-Ray Absorption Near Edge Structure • Region between absorption edge and start of EXAFS oscillations, up to 40 eV above edge • Absolute position of edge contains information on oxidation state • Also contains information on vacant orbitals, electronic configuration, and site symmetry
EXAFS Spectroscopy • X-ray Absorption Fine Structure • Above absorption edge, photoelectrons created by absorption of x-ray • Backscattering photoelectrons effect x-ray absorption • Oscillations in absorption above edge • Oscillations used to determine • atomic number • Distance • coordination number of nearest neighbors
XAS Procedure • Scanned U, Th, and Zr separately • Th L 3 edge to k = 13 • U L 3 edge to k = 14 • Zr K edge to k = 14 • U L 2 edge also scanned • Th EXAFS interference in U spectra due to proximity of edges
Uranium XANES • Tetravalent U for Zr=0 or 1 • U oxidation evident with higher Zr • Agrees with EELS
EXAFS Analysis • EXAFS equation • Phase(k) and Amp(k) calculated from theory • Fit data to determine: • N • coordination number • R • bond length • s • Debye-Waller term
EXAFS • Zr and U interchangeability limited • Mg affects U solubility • Increase in Mg decrease in U solubility • ThO2 structure • U and Th completely interchangeable in lattice • Th-Th(U): 3.941 + 0.010Å • Th-O: 2.402 + 0.005 Å
Characterization Results • Two phases • Th rich and Zr rich • Tetravalent U in ZrTh3UO10 and Th3UO8 • Identified by EELS and XANES • Unit Cell Parameter and Th interatomic distances agree with other work • Solubility Experiments • pH 4, 7, and 10 under Ar, pH 4, 5.25, 6.5 under Ar/10% CO2 • Collect samples up to 5 months