Network Dynamics and Cell Physiology
310 likes | 456 Vues
This work explores the intricate dynamics of cellular network signaling and information processing that govern cell physiology. It examines external and internal signals that regulate growth, development, division, and apoptosis. Key pathways and feedback mechanisms involved in signal transduction are analyzed, drawing upon foundational studies and contemporary models. With an emphasis on bistability and oscillatory behavior in cellular responses, this research provides valuable insights into the complex regulatory networks that sustain cellular life.

Network Dynamics and Cell Physiology
E N D
Presentation Transcript
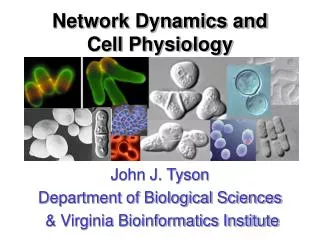
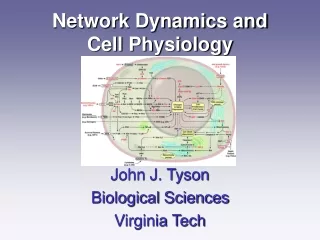
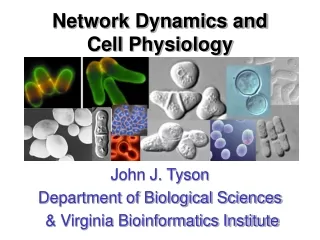
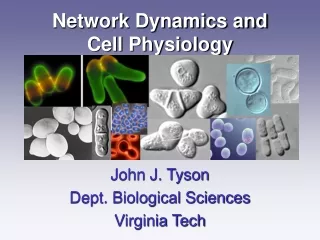
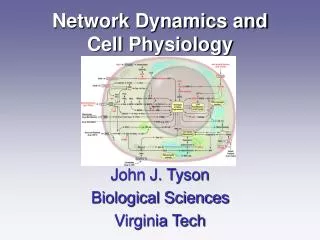
Network Dynamics andCell Physiology John J. Tyson Biological Sciences Virginia Tech
Collaborators Funding Agencies Kathy Chen Jill Sible Bela Novak Attila Csikasz DARPA McDonnell Found
External signals Growth Development Internal Signals Division Reproduction Death Information Processing System Cell signaling Hanahan & Weinberg (2000)
Brain Carbon Carbon Solid state Membrany Watery Digital Analog/digital Analog Sequential Parallel Parallel Programmable Learning Hard-wired Precise Accurate Sloppy Manufactured Soma/germ Self-reproducing Designed Evolved Evolved Information Processing Systems Laptop Cell Silicon Silicon Carbon Carbon $$
Smad p21 MKK MAPK MAPK-P PP2A Signal Transduction Network Hanahan & Weinberg (2000)
linear rate of degradation rate (dR/dt) S=3 response (R) S=2 S=1 rate of synthesis R signal (S) Gene Expression S R Signal-Response Curve
2 1.5 response (RP) 1 rate (dRP/dt) 0.5 0.25 RP Signal (Kinase) 1 R 0 “Buzzer” Protein Phosphorylation Kinase ADP ATP R RP H2O Pi Phosphatase Goldbeter & Koshland, 1981
S=16 S=8 S=0 response (R) rate (dR/dt) R signal (S) Protein Synthesis: Positive Feedback S Open R EP E Closed Bistability “Fuse” Griffith, 1968
dying Example: Fuse response (R) living signal (S) Eissing et al. (2004) J Biol Chem 279:36892 Apoptosis (Programmed Cell Death)
response (R) SN SN signal (S) “Toggle” Coupled Buzzers 1 S = Rtotal S=0.5 S=1 S=1.5 E R RP 0.5 E EP 0 0 0.5 1 1.5 R Bistability
metaphase response (MPF) interphase signal (cyclin) S = Total Cyclin Frog egg Wee1 MPF MPF = MPF-P CycB (inactive) M-phase Promoting Factor Cdc25-P Cdc25
M M M I/M I I I nM Dcyclin B MPF activity depends on total cyclin concentration and on the history of the extract M I Cyclin concentration increasing M MPF activity I I I I I I nM Dcyclin B Cyclin concentration decreasing inactivation threshold at 90 min MPF activity bistability Wei Sha & Jill Sible (2003)
Hopf Hopf response (MPF) sss uss sss signal (rate of cyclin synthesis) Oscillations MPF cyclin cyclin synthesis cyclin degradation APC MPF MPF-P (inactive) Cdc25-P Cdc25 negative feedback loop
Pomerening, Kim & Ferrell Cell (2005)
If knock-out positive feedback loop, then oscillations become faster and smaller amplitude… With + feedback Without + feedback Figure 4. Pomerening, Kim and Ferrell
Wee1 MPF P Cdc20 Cdc14 TFBA Wee1 TFBI CycB P APC-P APC Cdc14 Cdc25 P Cdc20 CycB Cdc14 Cdc25
Wee1 SPF P Cdc20 Cdc14 TFBA Wee1 TFBI CycB P APC-P APC Cdc14 Cdc25 P Cdc20 CycB Cdc14 Cdh1 Cdc25 CycD CKI CycB CycE TFII Cdh1 CycD CycA TFIA CKI CKI CycA Cdc20 CycA TFEA CycB TFEI
Cell Cycle Regulation high MPF high SPF DNA replication primed MEN fired RC Cdk2 Cdk1 cell division CycA CycB primed RC fired MEN low MPF low SPF
Cdk2 CycA time SPF Licensing Factor Replication Complex “Cock-and-Fire” Csikasz-Nagy & Novak, 2005
Cdk1 CycB time Primer MPF Mitotic Exit Network Csikasz-Nagy & Novak, 2005
Wee1 P mass/nucleus Cdc20 Cdc14 TFBA neg fdbk osc Wee1 TFBI CycB P APC-P APC Cdc14 Cdc25 P Cdc20 CycB Cdc14 Cdh1 Cdc25 CycD CKI bistable switch CycB CycE TFII Cdh1 CycD CycA TFIA CKI CKI CKI bistable switch CycA CycE Cyc E,A,B Cdc20 CycA CycE TFEA Fission Yeast CycB CycD CycA TFEI
Wee1 M M S/G2 M G1 P mass/nucleus Cdc20 Cdc14 TFBA Wee1 TFBI CycB P APC-P APC Cdc14 Cdc25 P Cdc20 CycB Cdc14 Cdh1 Cdc25 CycD CKI CycB CycE TFII Cdh1 CycD CycA TFIA CKI CKI CKI CycA CycE Cyc E,A,B Cdc20 CycA CycE TFEA Fission Yeast CycB CycD CycA TFEI
3.0 Wild type M 0.8 SNIC Cdk1:CycB 0.4 S/G2 G1 0 0 1 2 3 4 5 mass/nucleus
Saddle-Node on an Invariant Circle x2 SNIC max max saddle min node p1 SNICBifurcation Invariant Circle Limit Cycle
3.0 Wild type M 0.8 enter M exit M Cdk1:CycB 0.4 S/G2 S/G2 G1 0 cell division G1 0 1 2 3 4 5 mass/nucleus
Nature, Vol, 256, No. 5518, pp. 547-551, August 14, 1975 Genetic control of cell size at cell division in yeast Paul Nurse Department of Zoology, West Mains Road, Edinburgh EH9 3JT, UK wild-type wee1D
Wee1 P Cdc20 Cdc14 TFBA Wee1 TFBI CycB P APC-P APC Cdc14 Cdc25 P Cdc20 CycB Cdc14 Cdh1 Cdc25 CycD CKI CycB CycE TFII Cdh1 CycD CycA TFIA CKI CKI CKI CycA CycE Cyc E,A,B Cdc20 CycA CycE TFEA CycB CycD CycA TFEI
1.2 0.8 0.4 0 0 1 2 3 4 5 wee1D cells are about one-half the size of wild type wee1 M Cdk1:CycB S/G2 G1 mass/nucleus
2 x wee1+ wee1+/- wee1- Two-parameter Bifurcation Diagram B HB1 period SN2 (min) <30 60 Genetics 90 Wee1 activity 120 wild-type 150 180 210 240 270 300 300< SN1 cell mass (au.) Physiology
? ?
References • Tyson, Chen & Novak, “Network dynamics and cell physiology,” Nature Rev. Molec. Cell Biol. 2:908 (2001). • Tyson, Csikasz-Nagy & Novak, “The dynamics of cell cycle regulation,” BioEssays24:1095 (2002). • Tyson, Chen & Novak, “Sniffers, buzzers, toggles and blinkers,” Curr. Opin. Cell Biol.15:221 (2003). • Csikasz-Nagy et al., “Analysis of a generic model of eukaryotic cell-cycle regulation,” Biophys. J.90:4361 (2006).