Download
1 / 11
110 likes | 297 Vues
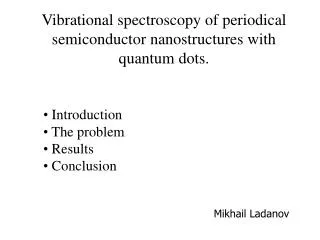
Vibrational spectroscopy of periodical semiconductor nanostructures with quantum dots. Introduction The problem Results Conclusion. Mikhail Ladanov. *. h. IR spectra. Dielectric function :. Bruggeman effective dielectric function approximation :. Effective dielectric function

E N D
Vibrational spectroscopy of periodical semiconductor nanostructures with quantum dots. • Introduction • The problem • Results • Conclusion Mikhail Ladanov
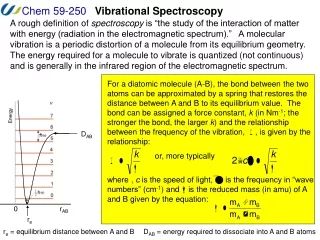
* h IR spectra Dielectric function: Bruggeman effective dielectric function approximation: Effective dielectric function Dielectric function of matrix Dielectric function of QD s
IR spectra of AlAs stuctures with QDs • Features corresponded to TO phonons in AlAs QD. • Low freq. shift of TO phonon in respect to the bulk one due to the stress.. • There’s no LO phonon peak.
Basic equations Dielectric continuum approximation: Lap. Eq. solution: (for prolate QD) Expression for freq. of IF phonons
IF phonons in QD. Oblate ellipsoid. Rp/Re = 1/2
IF phonons in QD. Prolate ellipsoid. Rp/Re= 2
Experimental Raman spectra of InAs QDs/AlAs (a), AlAs QDs/InAs (b) and InAs QDs/GaAs (c) structures. There’re features between LO and TO phonons freq. which cannot be explained in the frames of 2D structure model for big difference of layers thickness.
Experimental Raman spectra of InAs/AlxGa1-xAsstructures for different x. Spectra, marked with the dotted line, are measured in z(xx)-z scattering geometry, while those, marked with the solid line – in z(xy)-z scattering geometry.
- theory - experiment Freq. of IF phonons in InAs/AlGaAs structures
Conclusion The IR reflectionand Raman scattering of light by InAs/Al(Ga)Asand AlAs/InAs periodic structures with self-organizedquantum dots has been investigated. The Raman spectrameasured in different scattering geometries exhibitfeatures that correspond to optical TO and LO phononsand interface phonons. The frequencies of TO and LOphonons are displaced with respect to the correspondingvalues in bulk materials in view of mechanicalstresses. The lines of Raman scattering by interfacephonons are observed under conditions close to the resonanceconditions. The frequencies of interfacephonons lie in the spectral range between the frequenciesof TO and LO phonons. The experimental frequenciesof optical phonons have been used for calculatingthe frequencies of interface phonons in structures withquantum dots of different shapes in the approximationof a dielectric continuum. The frequencies of interfacephonons obtained within this model depend on theshape of the quantum dots. It has been shown that thedielectric-continuum approximation is an adequatemodel for calculating the frequencies of interfacephonons in InAs/AlxGa1–xAs quantum-dot structureswith any value of x. In this case, it is assumed that theshape of quantum dots is close to that observed in thespectra obtained by high-resolution electron microscopy.Thus, it has been shown that the Raman spectroscopyis sensitive to the shape of quantum dots.