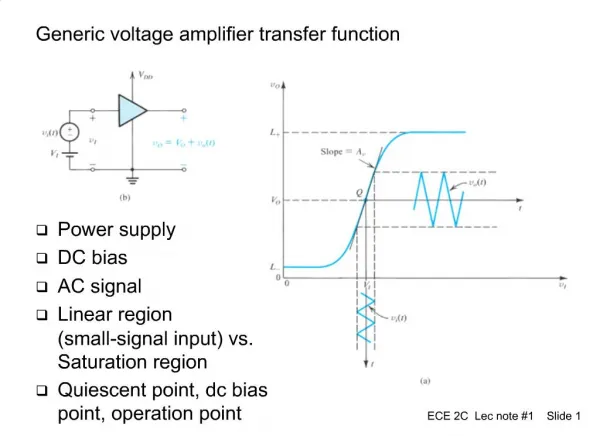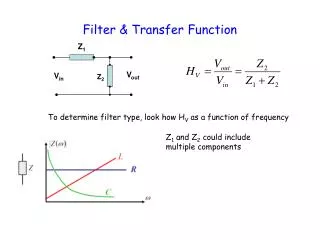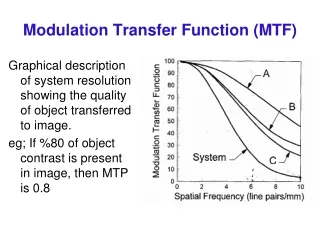
Modulation Transfer Function
Modulation Transfer Function. Fraunhofer Diffraction. The measure of the quality of the aerial image is given by The MTF is really a measure of the contrast in the aerial image The optical system needs to produce MTFs of 0.5 or more for a resist to properly resolve the features


Modulation Transfer Function
E N D
Presentation Transcript
Fraunhofer Diffraction • The measure of the quality of the aerial image is given by • The MTF is really a measure of the contrast in the aerial image • The optical system needs to produce MTFs of 0.5 or more for a resist to properly resolve the features • The MTF depends on the feature size in the image; for large features MTF=1 • As the feature size decreases, diffractions effects casue MTF to degrade
Contact and Proximity Systems • These systems operate in the near field or Fresnel regime • Assume the mask and the resist are separated by some small distance “g” • Assume a plane wave is incident on the mask. • Because of diffraction, light is bent away for the aperture edges • The effect is shown in the next slide • Note the small maximum at the edge; this results from constructive interference • Also note the ringing • To reduce these effect, we often use light sources with multiple wavelengths
Fresnel Diffraction • As g increases, the quality of the image decreases because diffraction effects become more important • The aerial image can generally be computed accurately whenwhere W is the feature size • Within this regime, the minimum resolvable feature size is
Resolution • A more exact solution for the theoretical resolution for proximity or contact aligners is given by: • Where l is the wavelength of light used to exposure the pattern, g is the distance between the bottom of the mask and the top of the photoresist, z is the thickness of the photoresist (typically 0.8-1.2mm).
Fresnel Number • Fresnel diffraction when F ≥ 1 • Fraunhofer diffraction when F << 1
Comparison of Depth of Focus http://www.research.ibm.com/journal/rd/411/holm1.gif
Photoresists • Photoresists change their chemical properties when exposed to light • Almost all photoresists are based on hydrocarbons • There are some inorganic resists (e.g., As2S3) • The light breaks chemical bonds in these materials • The photoresist then chemically rearranges itself into a more stable compound • Some positive photoresists may form smaller polymer chains, which are more soluble in developer after exposure • Negative photoresist forms larger polymer chains, which are less soluble in developer after exposure
Photoresists • Most resists in use today are positive resists because they have better resolution • Negative resists swell when exposed to light • Generally, resists are liquid at room temperature and are applied by placing a drop on the wafer and then spinning at high angular velocity (3-6k rpm) • The viscosity and spin speed determine the resist thickness. • Controlled by the type and volume of solvent • Once spun on, the wafer undergoes a pre-bake to drive off the solvent
Photoresists • Following pre-bake, the resist is exposed and developed • Developing is performed either by immersion or by spraying a developer (base) • After developing, the resist is baked again (postbake) to harden it and improve its resistance to etches • Long UV exposure can also be used to cross-link the polymer chains in the remaining photoresist • After the etch step, the resist is removed in an oxygen plasma or by a wet removal • Acetone if minimal hardbake • Variation on RCA etch or nitric acid
Photoresists • Parameters that determine the usefulness of the resist include • Sensitivity • - a measure of how much light is required to expose the resist • - typically 100mJ/cm2 • Resolution • - exposure, baking, developing must not degrade the quality of the image • Polymer used in Resist • - it must withstand the etching or ion implantation after the mask pattern is transferred to the resist
Photoresists • Photoresists usually contain three components • An inactive resin (usually a hydrocarbon which forms the base material) • Photoactive compound (PAC) • Solvent that is used to adjust the viscosity • The most common g- and i-line resists use • Diazonaphthoquinones (DNQ) as the PAC • Novolac as the resin • Propylene Glycol Monomethyl Ether Acetate (PGMEA) as the solvent • - this has replaced Cellosolve Acetate, which is a toxic hazard
Basic Structure of Novolac • Novolac is a polymer containing hydrocarbon rings with 2 methyl groups and 1 OH group • The basic ring structure is repeated to form a long chain polymer • Novolac readily dissolves in developer at a rate of ~15 nm/s
Diazoquinone • The photoactive part of the molecule is the part above the SO2 • The remainder of the molecule is represented by “R”
Diazoquinone • The function of the PAC is to inhibit the dissolution of the resin in the developer • DNQ is essentially insoluble in developer prior to exposure to light • When dissolved in the resin, they reduce the resist dissolution rate to 1—2 nm/s • When the resist is exposed to light, the diazoquinone molecule changes chemically
Diazoquinone • When exposed to light, the bonds to the weakly bound nitrogen are broken leaving a highly active carbon site • The molecule stabilizes itself by moving a carbon outside the ring and covalently bonding to an oxygen becoming a ketene molecule • This is known as the Wolf rearrangement • The ketene transform into carbolic acid in the presence of water • The carbolic acid is readily soluble in a basic developer • - TMAH – tetramethyl ammonium hydroxide, KOH or NaOH dissolved in water • The exposed resist now dissolves at about 100 – 200 nm/s • 10-100 times faster than the unexposed resist
Properties and Characteristics of Resists • Two parameters are used to define the properties of photoresists • Contrast • - Contrast is the ability of the photoresist to distinguish between dark and light • It is experimentally determined by exposing the resist to differing amounts of light, developed for a fixed time, and measuring the thickness of resist remaining after developing • Critical modulation transfer function (CMTF)
Photoresist Contrast • For positive resists, material exposed to low light will not be attacked by the developer; material exposed to large doses will be completely removed • Intermediate doses will result in partial removal • The contrast is the slope of this curve and is given by • Typical g- and i-line resists will achieve a contrast of 2—3 and Qf values of 100 mJ/cm2
Photoresist Contrast • The contrast is not a constant, but depends on process variables such as • development chemistry, • bake times, • temperatures before and after exposure, • wavelength of light, • age of resist, and • underlying structure • It is desirable to have as high a contrast as possible in order to produce the sharpest edges in the developed pattern
Photoresist Contrast This ‘poor’ quality image has been used to create periodic sine wave patterns in resist for optical gratings.
Modulation Transfer Function • We defined the MTF before in terms of a measure of the dark versus light intensities in the aerial image produced by the projection system • We define a similar quantity for the resist—the critical modulation transfer function (CMTF) • The CMTF is the minimum optical transfer function necessary to resolve a pattern in the resist • For g- and i-line resists, CMTF 0.4 • The CMTF must be less than the aerial image MTF if the resist is to resolve the aerial image
Effect of Resist Thickness • Resists usually do not have uniform thickness on the wafer • Edge bead: The build-up of resist along the circumference of the wafer • - There are edge bead removal systems • Step coverage Centrifugal Force
Effect of Resist Thickness • The resist can be underexposed where it is thicker and overexposed where it is thinner • This can lead to linewidth variations • Light intensity varies with depth below the surface due to absorptionwhere is the optical absorption coefficient • Thus, the resist near the surface is exposed first • We have good fortune. There is a process called bleaching in which the exposed material becomes almost transparent • i.e., decreases after exposure to light • - Therefore, more light goes to deeper layers
Photoresist Absorption • If the photoresist becomes transparent, and if the underlying surface is reflective, reflected light from the wafer will expose the photoresist in areas we do not want it to. • However, this leads to the possibility of standing waves (due to interference), with resultant waviness of the developed resist • We can solve this by putting an antireflective coating on the surface before spinning the photoresist increases process complexity
Standing Waves Due to Reflections http://www.lithoguru.com/scientist/lithobasics.html
Removal of Standing Wave Pattern (a) (b) (c) Diffusion during a post-exposure bake (PEB) is often used to reduce standing waves. Photoresist profile simulations as a function of the PEB diffusion length: (a) 20nm, (b) 40nm, and (c) 60nm. http://www.lithoguru.com/scientist/lithobasics.html
Mask Engineering • There are two ways to improve the quality of the image transferred to the photoresist • Optical Proximity Correction (OPC) • Phase Shift Masks (PSM) • We note that the lenses in projections systems are both finite and circular • Most features on the mask are square • We lose the high frequency components of the pattern • We thus lose information about the “squareness” of the corners
Mask Engineering • The effects are quite predictable • We can correct them by adjusting feature dimensions and shapes in the masks
Phase Shift Masks • In a projection system, the amplitudes of the diffracted light at the wafer add • Closely spaced lines interact; the intensity at the wafer is smeared • If we put a material of proper index of refraction on part of the mask, we can retard some of the light and change its phase by 180 degrees • Properly done, the amplitudes interfere • The thickness of the PS layer is n is the index of refraction of the phase shift material
Phase Shift Masks (PSM) Intensity pattern is barely sufficient to resolve the two patterns.