Statistics Boot Camp
Dive into the world of statistics, focusing on the critical elements of data collection, organization, analysis, and interpretation. This guide explores descriptive statistics, which summarize and organize data into meaningful patterns and can provide insights about a sample. Discover measures of central tendency like mean, median, and mode, and learn about variability through standard deviation and range. Also, delve into inferential statistics to understand how we draw conclusions about larger populations from sample data. Gain the statistical knowledge necessary to uncover insights that go beyond the unaided eye.

Statistics Boot Camp
E N D
Presentation Transcript
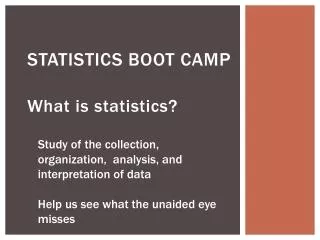
Statistics Boot Camp What is statistics? Study of the collection, organization, analysis, and interpretation of data Help us see what the unaided eye misses
Two Types • Descriptive Statistics: • Describe data • Help us organize bits of data into meaningful patterns and summaries • Tell us only about the sample we studied • Inferential: • Allow us to determine whether or not our findings can be applied to the larger population from which the sample was selected
Frequency distribution • If you could have any animal in the world for a pet, what would it be? • Definition: Arrangement of data from high to low, indicating the frequency of each piece of data • Frequency polygons: illustrated frequency distribution in a line graph • Histograms: illustrated frequency distribution in a bar graph • **Frequency is always on the Y axis (vertical)
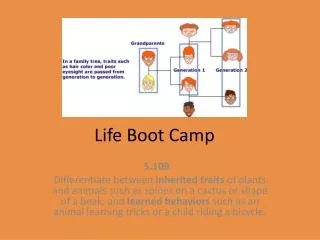
Measures of central tendency • Definition: a single score that represents a whole set of scores • Attempts to mark the center of a distribution • Three types: mean, median, mode • Mean: numerical average of a set of scores • Most commonly reported • Median: halfway mark in the data set, half of the scores are above and half are below • Write down numbers in ascending or descending order; find the halfway point, if there is an even number, take the average of the middle two scores • Why would we ever look at this? Extreme scores can drastically affect our mean
MCT cont. • Mode: Simplest measure; The score that occurs most frequently • When is this used? Depends on research question • 72% of Americans report having 0-1 drinks of alcohol per week; gov’t puts a tax on alcohol, it won’t affect most Americans • Bimodal (two modes) – better to use mode over mean/median in this case • Mean onset age for an eating disorder is 17 • Two modes: peak around 14 and peak around 18 • intervention program would be better suited for ages 14 and 18 than 17
outliers • Mean is most commonly used measure of central tendency but can be biased by a few scores (extreme scores, outliers) • Examples: • Bill Gates walks into a coffee shop. The average income of all patrons soars. Median wealth remains unchanged. • Republicans use the average income to discuss income growth; Democrats refer to the median • 19/20 of your friends have a car valued at $12,000, but another has a car valued at 120,000 • Mean is 17,400 • Not best measure; median is better
Measures of variability • Attempt to depict the diversity of a distribution of scores • Shows us how clustered our scores are around the mean • We can be more confident in our data if there is less variability • Example: Basketball player who averages 15 pts a game • Are you more confident if their range is between 13-17 pts in first 10 games or between 5-25 pts in the first 10 games? • Range: gap between the highest and lowest score • Subtract the low score from the high score
Measures of variability: Standard deviation • Standard deviation: a measure of how tightly clustered a group of scores is around their mean • Calculated by taking the square root of the variance • Both the SD and variance relate the average distance of any score in the distribution to the mean • The higher the variance and SD, the more spread out the distribution • Smaller the standard deviation, the more clustered the scores are around the mean
Standard deviation example • How much do employees at small businesses make? • 40,000 • 45,000 • 47,000 • 52,000 • 350,000 • Mean = 106,800 • Standard deviation = 136,021; Average difference between a score and the mean is 136,021 • Discard the extreme score, SD is now 4,966.56 • Distribution of first four is tightly clustered, distribution of all five is spread out
Normal distribution/Bell curve • Shows how scores are distributed in nature • Example: Height of humans • Symmetrical; Mean, median, mode are all in center • 68% of all scores fall within one standard deviation of the mean; 95% within two SD
Z-scores • Used to compare scores from different distributions • Can convert scores from the different distributions into z scores. Z scores measure the distance of a score from the mean in units of standard deviation • Scores below the mean have negative z scores • Scores above the mean have positive z scores • Amy scored a 72 on a test with a mean of 80 and SD of 8, her z score is -1 • Clarence scored an 84 on the test, his z score is +.5
Inferential statistics • Allows us to draw inferences from our data • Sometimes sets of data can differ because of chance, not because of a real difference • When differences between data are statistically significant, the observed differences is probably not due to a chance variation between the groups • Something is considered SS, if the odds of it occurring as a result of chance are less than 5% • p = .05
Percentiles • Indicate the distance of a score from 0 • 90th percentile means they scored better than 90% of the people who took the test