Download
1 / 32
320 likes | 324 Vues
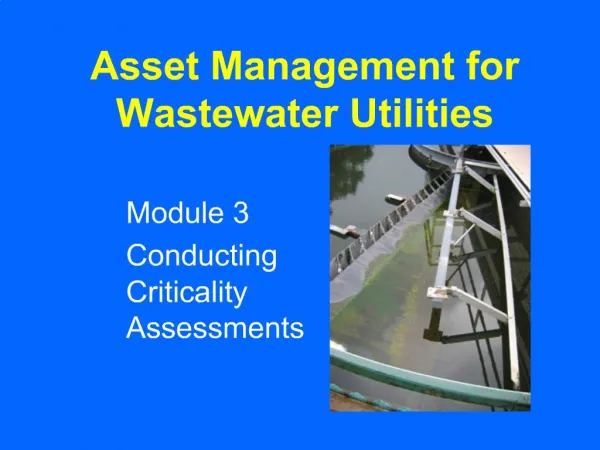
This project focuses on improving the existing wastewater dataset at MCAS Cherry Point through data integration, verification, and enhancing locational quality in order to create a complete and accurate GIS dataset.

E N D
Verification of Wastewater Utilities and Geometric Networks for Marine Corps Air Station (MCAS) Cherry Point, North Carolina Roger K. Cottrell, Jr., PMP, GISP May 9, 2012 Morgantown, WV
Overview • History of MCAS Cherry Point and GIS at MCAS Cherry Point, North Carolina • Existing Wastewater System at MCAS Cherry Point • Wastewater Project Problem Statement • Wastewater Project Goals • Wastewater Project Planning • Project Process • Project Results • Lessons learned
History of MCAS Cherry Point • MCAS Cherry Point opened in 1941 • The Air Station encompasses 29,000 acres and is equal in size to a small city Mission: “To provide the highest quality aviation facilities, support, and services to promote readiness, sustainment, and quality of life for Marines, Sailors, civilian Marines, family members and others associated with MCAS Cherry Point.”
History of GIS at MCAS Cherry Point • GIS program commissioned in 1996 • GIS is under the Facilities Systems Support Office (FSSO) • Has evolved into a highly developed, mature enterprise GIS program serving multiple departments • All spatial data is GEOFidelisModel compliant based on Spatial Data Standard for Facilities, Infrastructure, and Environment (SDSFIE v.6) • Enterprise ESRI shop
Wastewater Problem Statement • Wastewater system data scattered between several departments in different formats • Existing data outdated and incomplete • Existing data inaccurate • Existing data inadequate for use in any meaningful capacity • URS was commissioned to improve the existing wastewater dataset under an existing contract
Wastewater Project Goals • Integrate disparate datasets (CADD, hard copy, and GIS) into a complete GIS dataset • Verify location of existing wastewater features using GPS • Conflate and update existing attributes • Establish topology • Make final dataset GEOFidelis-compliant • Enhance locational quality of data • Build geometric network and calculate system capacity • Draft executive summary report
Wastewater Project Planning • Statement of Work • Milestone and Deliverable Schedule • Resource Management Plan • Quality Management Plan • Progress Reporting Plan • Data Management Plan • Communication Plan • Safety Plan • Assumptions and Constraints
Project Process • Research and planning • Existing data acquisition and integration • Feature location verification using GPS • Spatial layer creation • Geometric network and system capacity • Quality assurance/quality control
Project Process • Research & Planning • Meetings with subject matter experts • As-built plan acquisition and review • Non-spatial data acquisition and quality • Local knowledge
Project Process • Existing data acquisition and integration
Project Process • GEOFidelis-compliant GDB – 11 feature classes • Wastewater_disposal_tank_point • Waterwater_fitting_point • Wastewater_grease_trap_point • Wastewater_grit_chamber_point • Wastewater_inlet_point • Wastewater_junction_point • Wastewater_line • Wastewater_pump_point • Wastewater_septic_tank_point • Wastewater_valve_point • Wastewater_oil_wat_sparatr_point Existing GIS Data CADD files Analog Plans
Project Process • Feature location/verification using GPS – Data Work Flow • 2-3 GPS teams • Work divided into geographic sections and assigned to teams • Data was checked out of SDE database in versions as PGDB and placed on GPS units • Field crews updated the data and check data back into SDE versioned database • GIS Analysts checked out versions and performed edits, topology and attribution • Product was delivered as a PGDB and integrated into the GEOFidelisSDE database
Project Process • Feature location/verification using GPS • Trimble GeoXHreceivers • ArcPadQuickFormsto generate data dictionary and GUI • Laser range finder for touch spots • Collected 90 fixes per location • 5% of features were resurveyed for quality control • Collected digital photos of each feature and linked them in the GDB
Project Process • Post-processing in Trimble GPS Analyst extension • Used 3 primary CORS stations and 1 Backup • Castle Hayne • New Bern 6 • Pea Island • Washington (backup)
Project Process • Field GPS – Safety • Field safety is job one • Heat, confined spaces, chemical and biological hazards (snakes, bacterial, poisonous plants) • Near miss recorded on this job
Project Process • Spatial layer creation - geometry • GIS Analysts in the office cleaned data and built topology for each layer using GDB rules • GIS Analysts added attribution
Project Process • Spatial layer creation - attribution • GIS Analysts attributed each of the 11 datasets based on the Marine Corps’ GEOFidelis Data Model formulated from the Spatial Data Structure for Facilities, Infrastructure and Environment (SDSFIE) v2.6 • Subject matter experts were consulted throughout the process
Project Process • Spatial layer creation - attribution • Layers were attributed based on GEOFidelis Data Model • Metadata was added as well
Project Process • Geometric network and system capacity
Project Process • Geometric network and system capacity • A group of features, including junctions and edges, governed by preset connectivity rules • Allows users to model and analyze a system (water, wastewater, electric, etc.) that has a defined flow direction
Project Process • System Capacity • Modeled after similar study at the City of Lawndale, California • Enhanced geometric network with volume capacity processes and estimates • Used Manning’s Equation to calculate volume for wastewater lines • Incorporated operating capacities of pump stations • Calculations based on gal./day
Project Process • System Capacity • MCAS Cherry Point’s system is gravity fed. Manning’s Equation: • Slopeof wastewater pipeline • Diameterof wastewater pipeline • Wastewater volumeflowing out of buildings Where: V = Velocity in feet/second k = 1.49 for unit conversion n = Coefficient of roughness of pipe material S = Slope of wastewater line Rh = Hydraulic radius
Project Process Slope of pipe: • Values to the right are the minimum slope that gravity-fed wastewater lines are permitted to have in North Carolina • Due to the lack of data available for slope, the minimum required slope was assumed for each pipe diameter and local help
Project Process Diameter of pipe: • Using plans, URS updated many wastewater lines that were previously missing pipe diameters • URS used plans from Facilities and Engineering to populate these missing attributes • Pipes with empty values still participated in the network but did not have a Percent_Capacity value in the flow accumulation field
Project Process Flow from buildings: • Flow data was unavailable • Estimates of gallons per day per type of structure and total square feet of structure • Estimate sources: • North Carolina’s minimum design standards for sanitary sewer systems • City of Lawndale, CA study • URS professional experience to estimate the sewage flow for the remaining buildings by square foot – used engineering expertise from URS Water
Project Process Pump station capacity volume: • 79 pump stations currently in the GIS on Cherry Point’s main base • Attributed capacities for 29 pump stations using values provided by SMEs • Applied average rated capacity of the 29 pump stations to the remaining 50 pump stations
Project Process • Quality control
Project Process • Quality assurance Detail check included using a random number generator to choose a representative sample to check geometry and attribution.
Photo Linking Complete Dataset Geometric Network Product Results
Lessons Learned • Safety is most important aspect of all field work. • Local knowledge (SME) is key to a successful wastewater inventory. • GEOFidelis/SDSFIE Data Model can be cryptic and requires a steep learning curve early in the planning process. • Photo-linking proved to be a great asset to the client. • GDB rules proved to be very beneficial during editing process. • QA/QC process must start during the initiation and planning phase of the project to be most effective.
Acknowledgements Roger K. Cottrell, Jr., PMP, GISP – Project Manager Stephen Strain, GISP – Technical Coordinator Alice Mouraview – Director, MCAS Cherry Point FACSSO J. J. Chadwick – MCAS Cherry Point Subject Matter Expert Sallie Vaughn – GIS Analyst and Field Technician Laura Barrick – GIS Analyst and Field Technician Mark P. Smith – Sr. GIS Analyst and GPS Expert Cara Stackpoole – GIS Analyst and Field Technician Matthew Riley – Field Technician Contact: roger.cottrell@urs.com