Download
1 / 16
170 likes | 249 Vues
Explore the insights from "Que dicen los pobres" study in Argentina and Mexico, focusing on key indicators like income, water access, education, and health. Discover how poverty is measured and its impact on deprived populations in these Latin American countries.

E N D
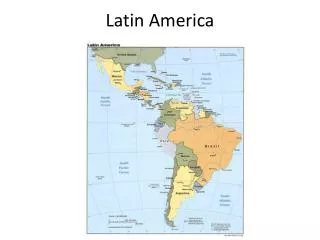
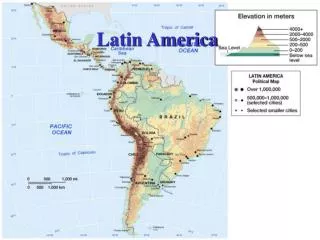
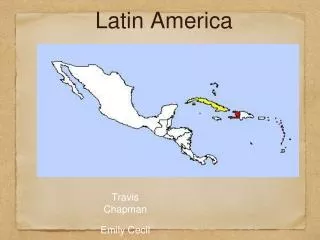
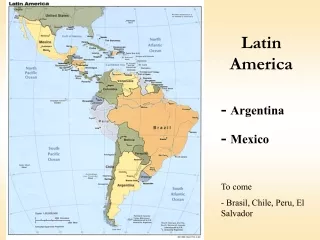
Latin America • - Argentina • - Mexico • To come • - Brasil, Chile, Peru, El Salvador
Basic Facts • Mexico • Population: 110 million • GNI per capita (PPP): $12,000 • Growth in 1995-2005: 3.7% • 1995 – 2000: 5.6% • 2000 – 2005: 1.8% • Argentina • Population: 40 million • GNI per capita (PPP): $11,670 • Growth in the 1995-2005: 2.1% • 1999- 2002: - 5%
Voices of the poor, in Mexico 3,000 “poor” people (adults) were interviewed They were asked to name and rank the most important aspects of deprivation and the said: Income Access of drinking water Education Health Nutrition Shelter “Que dicen los pobres”
Datasets • Mexico: ENIGH (Encuesta Nacional de Ingresos y gastos de los Hogares). Nationally representative. Years: 1994, 2000, 2006. • Argentina: EPH (Encuesta Permanente de Hogares). Urban, 60% total population. Years: 1995, 2000, 2003 • Unit of Analysis: Individuals – Households • Poverty measures regularly used: • Poverty Line (Food, Capabilities, Patrimony): Hincome • Unsatisfied Basic Needs: H
ARGENTINAContribution of each indicator to M0when k=3 and ‘ranking’ weight M0=0.016 M0=0.018 M0=0.032
ARGENTINAContribution of each indicator to M0when k=2 and ‘equal’ weight M0=0.035 M0=0.032 M0=0.046
MEXICOContribution of each indicator to M0when k=2 and ranking weight M0=0.041 M0=0.036 M0=0.048
MEXICOContribution of each indicator to M0when k=2 and ‘equal’ weight M0=0.041 M0=0.036 M0=0.048