
Uploaded by
maxima
2 SLIDES
103 VUES
20LIKES
Insights into Genetic Gain and Loss: A Comprehensive Study
DESCRIPTION
This research delves into the intricate mechanisms behind genetic gain and loss in various scenarios, providing significant findings applicable in relevant fields.
Download
1 / 2
Download Presentation

Télécharger la présentation
Insights into Genetic Gain and Loss: A Comprehensive Study
An Image/Link below is provided (as is) to download presentation
Download Policy: Content on the Website is provided to you AS IS for your information and personal use and may not be sold / licensed / shared on other websites without getting consent from its author.
Content is provided to you AS IS for your information and personal use only.
Download presentation by click this link.
While downloading, if for some reason you are not able to download a presentation, the publisher may have deleted the file from their server.
During download, if you can't get a presentation, the file might be deleted by the publisher.
E N D
Presentation Transcript
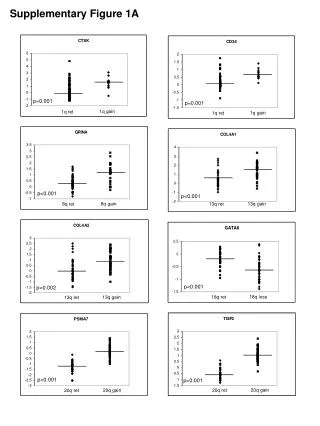
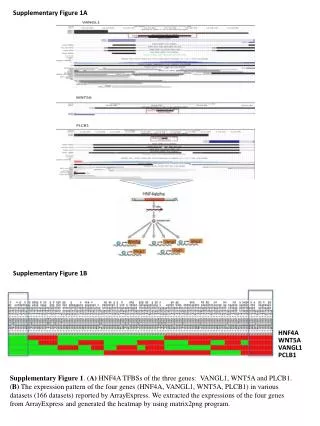
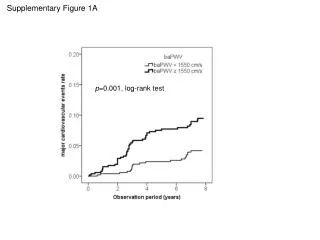
p=0.001 p=0.002 p=0.001 1q gain 1q ret 13q gain 13q ret 1q gain 1q ret p<0.001 13q gain 13q ret p<0.001 18q loss 18q ret p<0.001 8q gain 8q ret p<0.001 p<0.001 20q gain 20q ret 20q gain 20q ret Supplementary Figure 1A
Supplementary Figure 1B p=0.002 1q gain 1q ret p=0.25 p=0.069 13q gain 13q ret 1q gain 1q ret p=0.002 p=0.026 18q loss 18q ret 18q ret 18q loss p=0.033 8q gain 8q ret p=0.189 17p loss 17p ret p=0.064 20q gain 20q ret


More Related
Audio
Live Player