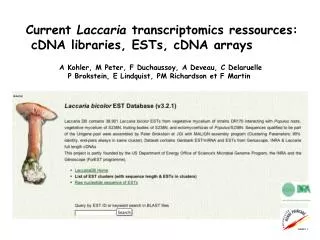
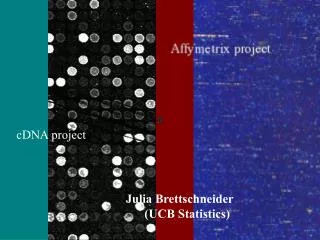
cDNA-Project
cDNA-Project. cDNA project. Julia Brettschneider (UCB Statistics). cDNA project. Biological question. What are the underlying molecular cascades that are activated following brain injury and lead the cells into and through cell death?. Experiments.

cDNA-Project
E N D
Presentation Transcript
cDNA-Project cDNA project Julia Brettschneider (UCB Statistics)
cDNA project
Biological question What are the underlying molecular cascades that are activated following brain injury and lead the cells into and through cell death?
Experiments • Platform: Incyte mouse cDNA arrays • Twelve cDNA dye swap pairs • 9024 genes total • 4 print-tip groups (48 x 47 spots each) • Controls: The last 24 spots in each print-tip group
Find differentially expressed genes… • injured (i) vs. sham (s) • hypocamp. subfield CA3 (C) vs. upper blade Dentate (D) • between different marker status (+,>,-) would also be interesting…
#01 iC+ sC- #02 iC- sC- #03 iD+ sD- #04 iD- sD- #05 iC+ iC- #06 iD+ iD- #07 sC- iC+ #08 iC- iC+ #09 sC- iC- #10 sD- iD+ #11 iD- iD+ #12 sD- iD- #13 iC+ iC> #14 iC> iC- #15 iC> sC- #16 iD+ iD> #17 iD> iD- #18 iD> sD- #19 iC> iC+ #20 iC- iC> #21 sC- iC> #22 iD> iD+ #2C iD> iD- #24 sD- iD> The 24 comparisons
Incyte’s Flags • Between 22% and 91% of the genes flagged, in 15 chips more than 50%, in 8 chips more than 75%. • Incyte’s criterion for flagging: - signal to bg ratio smaller than 2.5, or - spot area smaller than 40% in both dyes • Flagged genes are not used in normalization
Problems • Design (regions CA3 and dentate never hybridized together) • “Flagged genes” • Low quality chips • Inconsistent dye swap pairs • Normalization
Image analysis and normalization • Image analysis using “Spot” (Yang, Buckley, and Speed 1999, Program written by CSIRO Mathematics and Information Science) • Lowess normalization (Dudoit et al. 2000) for print-tip groups
Summary cDNA project • Image analysis redone • Normalization • Gene rank lists
Affymetrix Technoloy Statistics Drosophila project
Technology of oligonucleotide arrays • Each gene is interrogated by a number (16 - 20) of probe pairs • Each probe pair consists of two oligonucleotides (typically 25 bp long): Perfect Match (PM) fits the target exactly Missmatch (MM) has a middle base flipped
Chip Probes PM MM
PM MM …TGCTGGGTTACGCAGTCTTACTGACCATACACGCACTGCT… PM: AATGCGTCAGAATGACTGGTATGTGCGTCACGA MM: AATGCGTCAGAAAGACTGGTATGTGCGTCACGA ^ missmatch position
Steps in the analysis • Converting .cel file into probe pair data • Normalization • Calculation of an expression value for each gene based on the intensities of its 20 probe pairs • Comparing treatment/control, WT/mutant etc. • Hypothesis testing • Clustering • etc.
Gene expression estimation Genechip (Affymetrix): Average difference between the probe pairs Average log ratio Now: robust/resistent version
Gene expression estimation Li and Wong (2000) fit a model expression in chip i (j probe pair index)
Gene expression estimation Irizarry, Speed et al. (2002): Average log (PM - BG), where BG global background Now: robust version using median polish
Axon guidance in the Drosophila CNS • How do neurons find their correct targets, make appropriate synaptic connections, and set and adjust their size and strength? • Find genes which regulate these mechanisms by comparing different mutants • Loss Of Function (LOF) and Gain Of Functions (GOF) mutants for a number of proteins
Robo, Slit & Comm • Robo: transmembrane protein, receptor for slit, negatively controlled by Comm • Slit: extracellular protein, expressed by midline glia, ligand for Robo receptor • Comm: surface protein, expressd on midline cells, transferred to commissural neurons
Experiments • 12 (plus…) different mutants, plus WT • 4 replicates for each • Affymetrix Drosophila chips • about 13 thousand genes in total
Comparisons Formulate particular questions/hypothesis for subgroups of comparisons, - Slit and Robo, Robo2 mutants have similar phenotypes, compare their gene expression - Compare Robo1, Robo2, and Robo1,2 - etc.
Data Analysis • Using Affy R-package (Bolstad, Irizarry) • Quantile normalization (Bolstad 2001) • Currently implementing an additiv model on the probe pair level: - simultanously for mutant/WT - incorporates replicates
Ben Bolstad Sandrine Dudoit Phil Spector Terry Speed Jean Yee Hwa Yang (UCB Statistics) Tiago Magelhaes (Goodman lab, UCB) Paolo Marciano (Pennsylvania) Francois Collin (Genlogic) Rafael Irizarry (Johns Hopkins) Acknowledgement www.stat.berkeley.edu/users/terry/zarray/Html/index.html