Download
1 / 6
60 likes | 128 Vues
Explore enhanced MNAse sensitivity and nucleosome dynamics in IFNg-induced cells, showcasing resistance to MNAse digestion. Detailed analysis using qChIP and qPCR techniques reveal significant molecular changes.

E N D
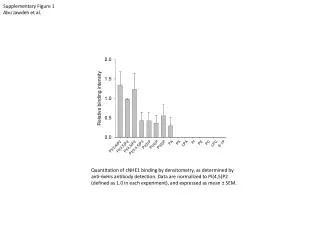
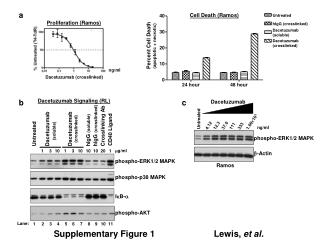
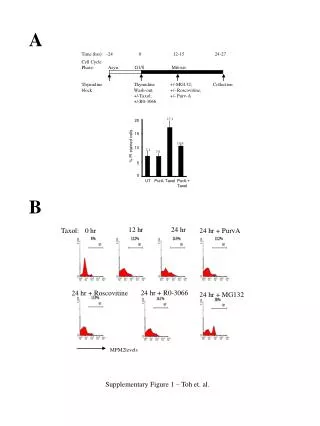
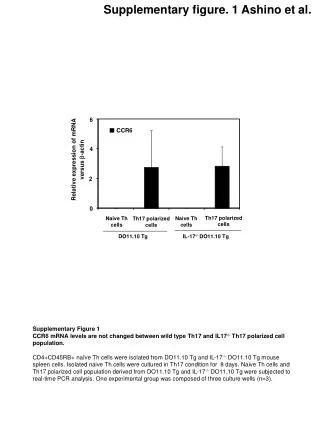
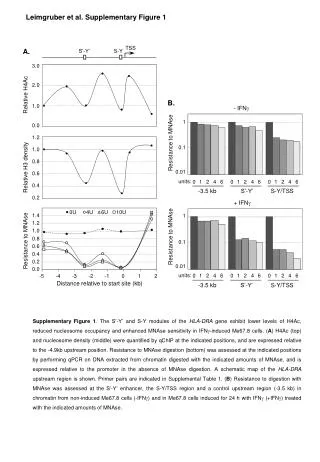
A. TSS S’-Y’ S-Y B. - IFNg 1 Resistance to MNAse 0.1 0.01 units: 0 1 2 4 6 0 1 2 4 6 0 1 2 4 6 3.0 -3.5 kb S’-Y’ S-Y/TSS 2.0 + IFNg Relative H4Ac 1.0 1 Resistance to MNAse 0.0 0.1 1.2 0.01 Resistance to MNAse units: 0 1 2 4 6 0 1 2 4 6 0 1 2 4 6 1.0 Relative H3 density -3.5 kb S’-Y’ S-Y/TSS 0.8 0.6 0.4 Supplementary Figure 1. The S’-Y’ and S-Y modules of the HLA-DRA gene exhibit lower levels of H4Ac, reduced nucleosome occupancy and enhanced MNAse sensitivity in IFNg-induced Me67.8 cells. (A) H4Ac (top) and nucleosome density (middle) were quantified by qChIP at the indicated positions, and are expressed relative to the -4.9kb upstream position. Resistance to MNAse digestion (bottom) was assessed at the indicated positions by performing qPCR on DNA extracted from chromatin digested with the indicated amounts of MNAse, and is expressed relative to the promoter in the absence of MNAse digestion. A schematic map of the HLA-DRA upstream region is shown. Primer pairs are indicated in Supplemental Table 1. (B) Resistance to digestion with MNAse was assessed at the S’-Y’ enhancer, the S-Y/TSS region and a control upstream region (-3.5 kb) in chromatin from non-induced Me67.8 cells (-IFNg) and in Me67.8 cells induced for 24 h with IFNg (+IFNg) treated with the indicated amounts of MNAse. 0.2 0U 4U 6U 10U 1.4 1.2 1.0 0.8 0.6 0.4 0.2 0.0 -5 -4 -3 -2 -1 0 1 2 Distance relative to start site (kb) Leimgruber et al. Supplementary Figure 1
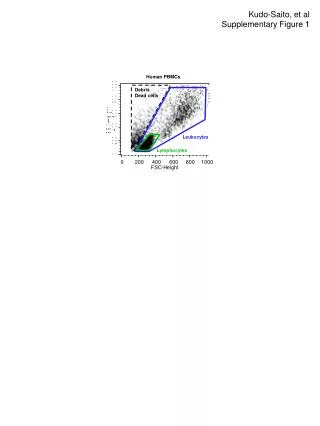
MNAse units 0 1 2 6 10 0 1 3 6 tri 400 bp di nucleosome ladder 300 bp Size marker mono 200 bp 100 bp Nuclei DNA Supplementary Figure 2. DNA obtained by digestion with the indicated amounts of MNAse of nuclei (left) or purified genomic DNA (right) was analyzed by gel electrophoresis. The positions of mono-, di- and tri-nucleosomes (left), and the sizes in bp of marker fragments (right), are indicated. Block arrows indicate the digestion conditions used for experiments. Leimgruber et al. Supplementary Figure 2
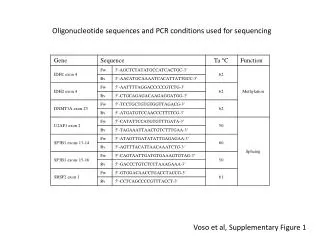
TSS 0U 4U 6U 10U Supplementary Figure 3. The S’-Y’ and S-Y modules of the HLA-DRA gene exhibit enhanced MNAse sensitivity in Raji B cells. Resistance to MNAse digestion was assessed at the indicated positions by performing qPCR on DNA extracted from chromatin digested with the indicated amounts of MNAse, and is expressed relative to the promoter in the absence of MNAse digestion. A schematic map of the HLA-DRA upstream region is shown. Primer pairs are indicated in Supplemental Table 1. 1.4 1.2 1.0 0.8 S’-Y’ S-Y Resistance to MNAse 0.6 0.4 0.2 -5 -4 -3 -2 -1 0 1 2 Distance relative to start site (kb) Leimgruber et al. Supplementary Figure 3
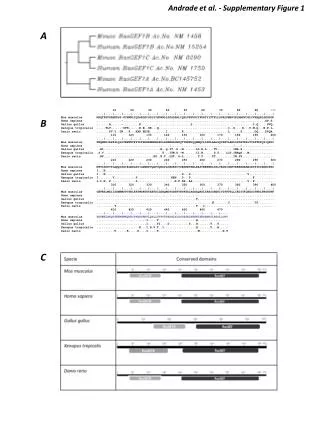
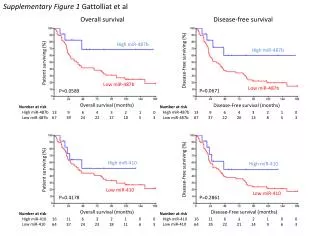
RFX-/- CIITA-/- WT * b (2.7 kb) a (2.5 kb) DNAse I DNAse I DNAse I a b Pst I Pst I 6.1 kb S-Y E1 E2 E3 2.5 kb 2.7 kb probe Supplementary Figure 4. Southern blot analysis of DNase I hypersensitive sites flanking the HLA-DRA S-Y module in wild type Raji B cells (WT), RFX-deficient B cells (RFX-/-) and CIITA-deficient B cells (CIITA-/-). The two hypersensitive sites flanking the S-Y module (right, arrows labelled a and b) are detected in WT and CIITA-/- cells but not in RFX-/- cells. A schematic map of the Southern blotting strategy is indicated below. *, contaminating band of unknown origin. Leimgruber et al. Supplementary Figure 4
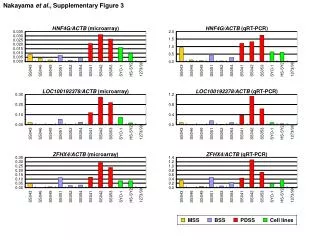
0 0 0 0 0 0 0 0 0 1 1 1 1 1 1 1 1 1 2 2 2 2 2 2 2 2 2 3 3 3 3 3 3 3 3 3 4 4 4 4 4 4 4 4 4 5 5 5 5 5 5 5 5 5 CD74 (MHCII - Ii chain) CUTA BAT1 C6orf48 GAPDH Fold nucleosome depletion (1/2^(ratio ChIP WT / input DNA))) RGL2 TAPBP TUBB LTB -0.8 -0.4 0 0.4 0.8 -0.8 -0.4 0 0.4 0.8 Distance relative to start site (kb) Supplementary Figure 5. Nucleosome occupancy at the TSS of the MHCII-associate invariant chain (Ii) gene (CD74) and non-MHCII genes. Nucleosome occupancy at the indicated genes was analyzed by ChIP-chip. Results represent the fold depletion observed in ChIP samples from wild type Raji B cells (WT) relative to input DNA. TSSs are indicated by arrows. Leimgruber et al. Supplementary Figure 5
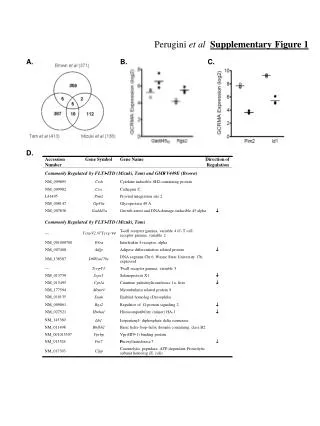
A. TSS DRA S-Y DRA+150a DRA+150b luciferase -400 -300 -200 -100 100 200 300 B. 6 5 C. 4 Fold induction (luciferase) 3 1.0 2 0.8 1 0.6 Relative luciferase activity 0.4 h IFNg: 0 12 24 48 0 12 24 48 0 12 24 48 0.2 DRA DRA+150a DRA+150b DRA vector DRA+150a Supplementary Figure 6. Nucleosome displacement from the TSS is required for activation of the HLA-DRA gene. (A) Schematic representation of the wild type (DRA) and mutated (DRA+150a, DRA+150b) constructs. Maps show the S-Y modules (open boxes), TSSs (arrows), the two different inserted 150 bp sequences (DRA+150a, crosshatched box; DRA+150b, stippled box) and the predicted position of the NFRs (gray boxes). (B) Each construct was transduced into Me67.8 cells using lentiviral vectors, and luciferase activity was measured after induction of the transduced cells with IFNg for the indicated times. Results are represented as fold induction relative to uninduced cells, and show the means and standard deviations derived from three independent experiments. (C) Luciferase promoter activity was measured in Raji B cells transduced with the DRA and DRA+150a constructs, or with the empty lentiviral vector. Results are represented relative to the activity of the wild type DRA construct and show the means and standard deviations derived from three independent experiments. Leimgruber et al. Supplementary Figure 6