Download
1 / 6
60 likes | 139 Vues
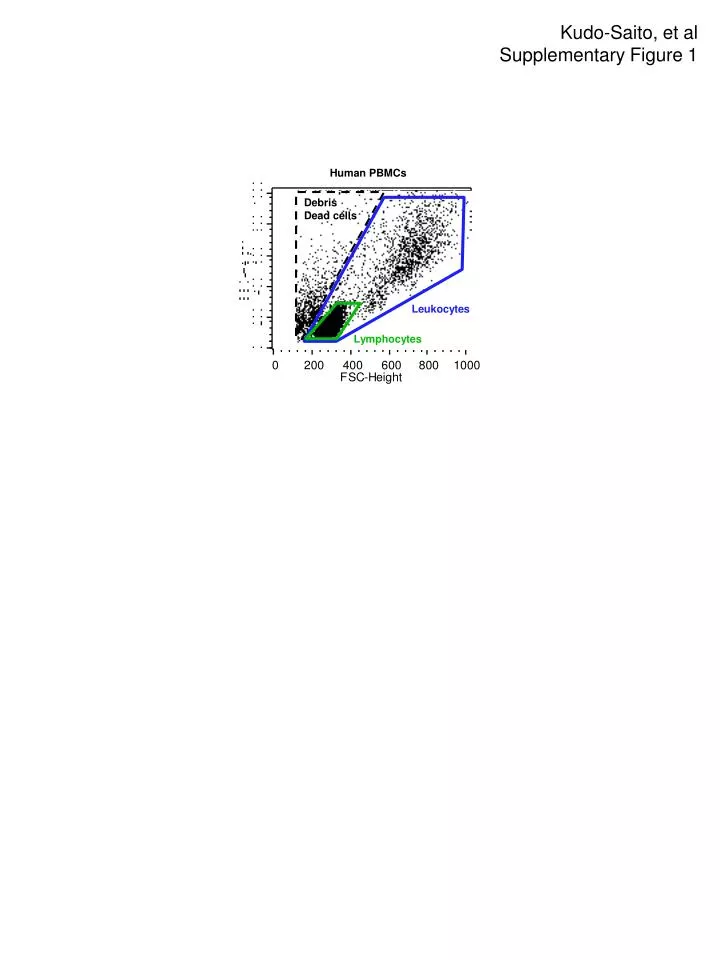
Kudo-Saito, et al Supplementary Figure 1. Human PBMCs. Debris Dead cells. Leukocytes. Lymphocytes. Kudo-Saito, et al Supplementary Figure 2. Mock D6 D10 F3 F5 NC. Transfectants. Normalization. (a). 0.8 0.6 0.4 0.2 0.0. Snail. Snail Slug Twist E-cadherin Fibronectin

E N D
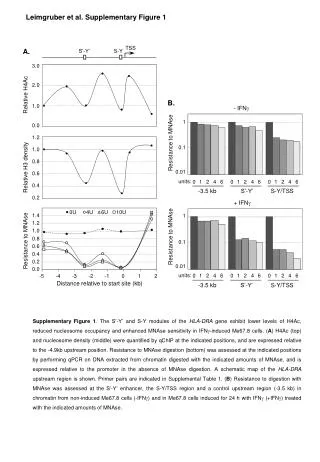
Kudo-Saito, et al Supplementary Figure 1 Human PBMCs Debris Dead cells Leukocytes Lymphocytes
Kudo-Saito, et al Supplementary Figure 2 Mock D6 D10 F3 F5 NC Transfectants Normalization (a) 0.8 0.6 0.4 0.2 0.0 Snail Snail Slug Twist E-cadherin Fibronectin MMP2 Collagen IV GAPDH 0.6 0.4 0.2 0.0 E-cadherin 0.8 0.6 0.4 0.2 0.0 Mock D6 D10 F3 F5 Fibronectin (b) Panc1-mock D6-snail+ D10-snail+ F3-snail+ F5-snail+ Morphology Snail E-cadherin Fibronectin (c) Proliferation Adhesion Invasion 1.5 1.0 0.5 0.0 400 300 200 100 0 2.0 1.5 1.0 0.5 0.0 No. of cells Absorbance (570nm) Mock D6 D10 F3 F5 Absorbance (450-655nm) Mock D6 D10 F3 F5 Mock D6 D10 F3 F5
Kudo-Saito, et al Supplementary Figure 3 Snail transfectants (a) CCL2 LCN2 0.6 0.4 0.2 0.0 Mock E9 H6 0.8 0.6 0.4 0.2 0 Snail CCL2 LCN2 GAPDH ng/ml Mock E9 H6 Mock E9 H6 Control Snail CCL2 #1 CCL2 #2 Mock CCL2 LCN2 H6 + siRNA (b) 0.5 0.4 0.3 0.2 0.1 0.0 1.0 0.8 0.6 0.4 0.2 0.0 ng/ml Snail CCL2 LCN2 GAPDH Control Snail CCL2 Mock Control Snail CCL2 Mock H6 + siRNA H6 + siRNA (c) H6 + siRNA F10-mock Control Snail CCL2 12.25 62.47 17.78 19.40 Foxp3 in CD4+ cells
Kudo-Saito, et al Supplementary Figure 4 B16-F10 tumors (a) (b) Control siRNA-snail siRNA-CCL2 600 400 200 0 1.15 2.53 3.61 1.67 5.13 4.48 CD4 Tumor volume (mm3) CD8 Control Snail CCL2 60% (816) 64% (466) 62% (630) B16-F10 + siRNA Foxp3 in CD4+ cells (c) 81% (535) 79% (2058) 78% (1984) 800 600 400 200 0 IFN-γ (pg/ml) Gp70 tetramer in CD8+ cells 2.67 9.13 18.36 Control Snail CCL2 I-A(b) 1.49 0.61 5.42 B16-F10 + siRNA CD11c
Kudo-Saito, et al Supplementary Figure 5 H6-snail+ tumors F10-mock Control siRNA-snail siRNA-CCL2 1.15 0.07 1.17 1.85 CD4 1.67 0.13 2.38 2.09 CD8 60.43 (816) 81.67 (1430) 82.17 (1180) 74.91 (1150) Foxp3 in CD4+ cells 81.29 (535) 13.34 (289) 64.92 (1521) 71.38 (2231) Gp70 tetramer in CD8+ cells 2.67 1.05 5.99 4.12 I-A(b) 1.49 2.18 16.62 10.26 CD11c
Kudo-Saito, et al Supplementary Figure 6 Snail+ cancer cell undergoing EMT Enhancement of cancer invasion LCN2 release (autocrine) CCL2 release Recruitment of CD4lowFOXP3+CCR2+ Treg Induction of CD4+FOXP3+ Treg Induction of CD11c+HLA-DRlow DCreg Inhibition of CTL induction