The Scientific Method:
A comprehensive guide to conducting experiments following the scientific method, from identifying a problem to making conclusions. The flipbook includes steps like problem identification, research, hypothesis writing, experiment planning, data collection, analysis, and drawing conclusions. It emphasizes the importance of controlled experiments, detailed procedures, data recording, and critical thinking. Ideal for students and educators in science and research fields.

The Scientific Method:
E N D
Presentation Transcript
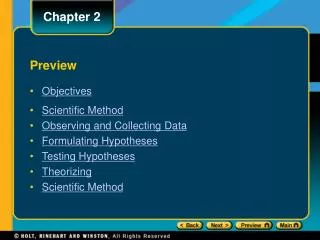
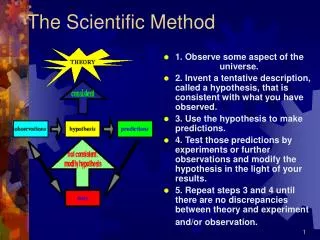
The Scientific Method: the steps you follow to do an experiment A flipbook of the inquiry process!
1. IDENTIFY A PROBLEM • Always a question! • Two acceptable formats: • What is the effect of IV on DV? • How does IV affect DV? • INDEPENDENT VARIABLE = the part the experimenter purposely changes! • DEPENDENT VARIABLE = the part the experimenter measures/records • HAS to be answered by an experiment! • CAN NOT be answered by “yes” or “no”!
2. RESEARCH • Gather information on the topic • Specifically, look for background information about the VARIABLES! • Use a variety of sources • websites • Books • Magazines • encyclopedias, etc. • Cite the sources properly (check with your science or language arts teacher!)
3. WRITE A HYPOTHESIS • The “educated guess” • Educated because it is based on the research! • It is a prediction of what the results of the experiment will be • ONE acceptable format: • If (insert information about what will be done to the IV), then (insert your prediction of what will happen to the DV). • Must be a statement that can be tested!
4.PLAN & CONDUCT THE EXPERIMENT (Procedures) • List the DETAILED steps to follow • Include sizes, measurements, HOW to do each step….include pictures if necessary! • Make sure it is CONTROLLED • Has ONE independent variable • Has THREE levels of the IV • Has THREE trials • Create a materials list • NOW, follow the procedures!
5. COLLECT DATA & OBSERVATIONS • Write down everything you see, notice, or measure • Include QUALITATIVE (parts you describe with your senses & words!) DATA • Include QUANTITATIVE (parts you measure, time, count, etc that you record with numbers!) DATA • Put everything into chart form (data table)
6. ANALYZE DATA & OBSERVATIONS • Put the quantitative data into GRAPH form • Choose the appropriate graph (bar, line, etc) • Create a RESULTS paragraph. Include: • What was learned from the charts & graphs • What does the graph represent? • What are some interesting features about the data? • What does the graph/data show? Summarize it in words & explain any trends. • Is the hypothesis supported or denied? Why?
7. MAKE CONCLUSIONS • Summarize the WHOLE experiment in a QUALITY PARAGRAPH! Include: • Restate the problem • State the MAJOR findings of the experiment (what is the answer to the problem?) • Tell if the hypothesis was SUPPORTED or DENIED. Explain why. • Rewrite a hypothesis based on the experimental results
7. MAKE CONCLUSIONS (cont.) • Compare the original (book) and experimental research. Explain similarities & differences • Explain sources of error. What went wrong? What affected the results? • Make recommendations for future research. (Write a NEW problem to experiment with in order to get more information on the topic) • Explain the impact on the scientific community (why would others care about what was learned?)