Download
1 / 20
200 likes | 300 Vues
Discover the journey of seismographs, their evolution from Mercalli scale to Richter magnitude, and how they detect earthquakes. Learn about the first seismograph, significant earthquakes in history, and the principles behind measuring seismic waves.

E N D
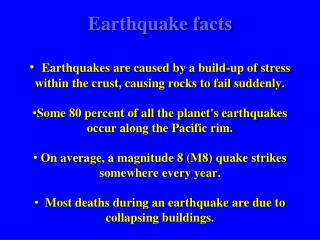
Seismographs – devices that detect earthquakes. When was the first seismograph used? Around 2000 years ago….
big heavy mass Inertia keeps the mass “in one place.”
The frog that caught the ball shows the direction from which the earthquake came.
Heavy mass stays still Earth, building, table, all shake back and forth.
Richter Magnitude - measures amplitude of waves - measures size of EQ, not damage - nomogram used to calculate RM
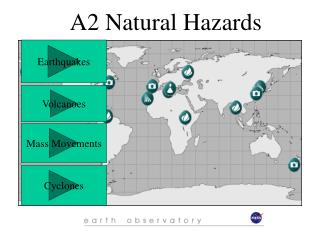
The Largest Earthquakes in the World in the Past 10 Years: 1989 to 1998
Location Date UTC Magnitude Coordinates 1. Chile 1960 05 22 9.5 38.2 S 72.6 W 2. Prince William Sound, Alaska 1964 03 28 9.2 61.1 N 147.5 W 3. Andreanof Islands, Aleutian Islands 1957 03 09 9.1 51.3 N 175.8 W 4. Kamchatka 1952 11 04 9.0 52.75 N 159.5 E 5. Off the Coast of Ecuador 1906 01 31 8.8 1.0 N 81.5 W 6. Rat Islands, Aleutian Islands 1965 02 04 8.7 51.3 N 178.6 E 7. India-China Border 1950 08 15 8.6 28.5 N 96.5 E 8. Kamchatka 1923 02 03 8.5 54.0 N 161.0 E 9. Banda Sea, Indonesia 1938 02 01 8.5 5.25 S 130.5 E 10. Kuril Islands 1963 10 13 8.5 44.9 N 149.6 E
What did the Mercalli scale measure?
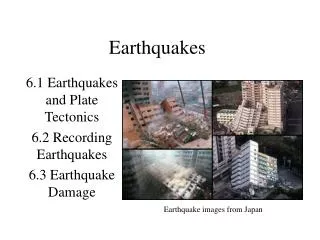
Isoseismal lines - joins areas of equal damgage.
When the Imperial Valley earthquake of 15 October 1979 (M=6.4) struck southernmost California, lots of scientists showed up from the U.S. Geological Survey. The flat, open farmland displayed many kinds of ground disturbance to advantage. But Robert Nason, a veteran USGS researcher, went indoors to grocery stores, examining the mess that the quake left behind and treating the stores like seismometers. Weak earthquake shaking tosses a few cans into the aisles, while stronger shaking throws everything off the shelves, then knocks down the shelves themselves. Nason showed that your average 7–11 can be a pretty dependable gauge of seismic intensity. He turned his research into "Food store disturbance as a seismic intensity indicator" in the Bulletin of the Seismological Society of America, better known in the trade as the BSSA.
In 1902, Italian volcanologist Giuseppe Mercalli created a twelve-degree scale of intensity. The Richter Magnitude Scale was developed in 1935 by Charles F. Richter of the California Institute of Technology. On the Richter Scale, magnitude is expressed in whole numbers and decimal fractions. For example, a magnitude 5.3 might be computed for a moderate earthquake, and a strong earthquake might be rated as magnitude 6.3. Because of the logarithmic basis of the scale, each whole number increase in magnitude represents a tenfold increase in measured amplitude; as an estimate of energy, each whole number step in the magnitude scale corresponds to the release of about 31 times more energy than the amount associated with the preceding whole number value.
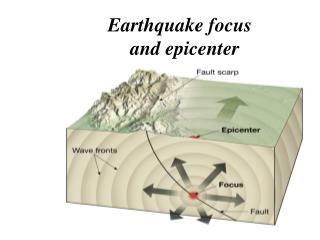
A single seismograph pendulum works in only one direction, and cannot give a complete picture of wave motions from other directions. To overcome this problem, modern seismograph stations have three separate instruments to record horizontal waves - (1) one to record the north-south waves, (2) another to record east-west waves, and (3) a vertical one in which a weight resting on a spring tends to stand still and record vertical ground motions. The spring-suspended mass lags behind the motion caused by the earthquake, making the pen record the waves on the drum. This combination of instruments tells a seismologist the general direction of the seismic wave source, the magnitude at its source, and the character of the wave motion. Instruments at other stations must be used to get a precise fix on the earthquake's epicenter.