
Effects of β-hCG on Syncytia Formation and Desmoplakin Staining in Cell Culture
This study evaluates the impact of β-hCG on syncytia formation and desmoplakin expression in cell culture models. Results show altered mRNA expression levels of ST1, ST2, and β-hCG/HPRT, with control groups treated with EG-VEGF and forskolin. Syncytia quantification and desmoplakin staining reveal significant changes. The findings suggest a potential role of β-hCG in cell fusion processes and cellular junction maintenance.

Effects of β-hCG on Syncytia Formation and Desmoplakin Staining in Cell Culture
E N D
Presentation Transcript
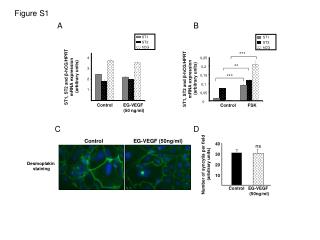
ST1 ST1 ST2 ST2 hCG hCG Figure S1 A B *** 4 0,25 ** 0,2 3 ST1, ST2 and β-hCG/HPRT mRNA expression (arbitrary units) ST1, ST2 and β-hCG/HPRT mRNA expression (arbitrary units) *** 0,15 2 0,1 1 0,05 0 Control EG-VEGF (50 ng/ml) Control FSK C D Control EG-VEGF (50ng/ml) 40 ns 30 Number of syncytia per field (arbitrary units) Desmoplakin staining 20 10 Control EG-VEGF (50ng/ml)


