Download
1 / 59
590 likes | 665 Vues
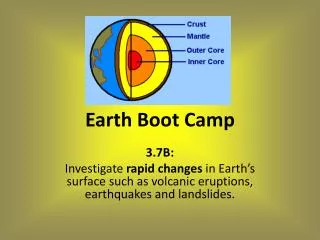
GIS BOOT CAMP. Todd Bacastow. Geography matters!. ‘Geographic Information’ is information which can be related to specific locations. Most human activity depends on geographic information. Topic 1: What is GIS?. Dozens of possible definitions Some emphasise the technology The Hardware

E N D
GIS BOOT CAMP Todd Bacastow
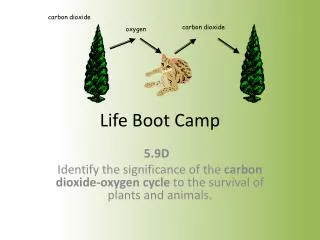
Geography matters! • ‘Geographic Information’ is information which can be related to specific locations. • Most human activity depends on geographic information.
Topic 1: What is GIS? • Dozens of possible definitions • Some emphasise the technology • The Hardware • The Software • Others focus on applications • Other terms often encountered: LIS, AM/FM, Geo-information systems, etc. • May emphasise different roles for the system, e.g. spatial decision support system, spatial database system, etc.
One definition of GIS (Dueker and Kjerne, 1989) • “Geographic Information Systems - A system of hardware, software, data, people, organizations and institutional arrangements for collecting, storing, analysing, and disseminating information about areas of the Earth”
GIS as a tool • Majority view of GIS • Focus is on hardware, software and routines • A technocentric perspective • The favoured viewpoint of the system vendors
GIS as science • Emphasis is on data, human uses, contexts • A more academic perspective • Geographic information science is the “science behind the systems” • Includes concepts of spatial reasoning, cognition, human-machine communication, visualisation, data modelling, etc.
GIS is a product of a particular culture • Most GIS developed in Europe/N. America • USA: Arc/Info, ArcView, Intergraph, Bentley, Autodesk, MAP, GRASS... • Canada: Caris, Spans, GeoVision... • France: GeoConcept, Carto 2-D... • UK: Smallworld, GIMMS, Laserscan... • Netherlands: ILWIS, PC Raster...
GIS is a commercial product • Developments often driven by commercial considerations, less by scientific ones • Vendor’s decisions usually based on questions of profitability • Critical evaluation of proprietary GIS is rare
What GIS is not • GIS is not simply the technology: it also has a (growing and important) conceptual base • GIS can not produce good results from bad data or poor conceptual frameworks • GIS is not simply a program to produce maps • GIS is not a substitute for thinking! • GIS is not the universal answer to all problems!
Data input - a major bottleneck • Costs of input often >80% of project costs • Labor intensive, tedious, error-prone • Construction of the database may become an end in itself • the project may not move on to analysis of the data collected • Essential to find ways to reduce costs, maximise accuracy
Sources of digital map data • National Mapping Organization • Other government agencies • Commercial data vendors
Standards • standards may be set to • assure uniformity within a single data set or across several data sets • ensure the data can be shared across different hardware and software platforms
What if the Data do not exist at all? • Field data capture • May be done manually (e.g. direct survey), automatically (e.g. automatic data loggers, etc.) or a combination of the two • Remote sensing • Includes satellite imagery, geophysical survey, air photos • May be used as alternative source of data
Integrating different data sources: issues • Formats • many different format standards exist • a good GIS can accept and generate datasets in a wide range of standard formats
Integrating different data sources: issues • Projections • Many ways exist to represent curved surface of the earth on a flat map • Some projections are very common • A good GIS can convert data from one projection to another, or to latitude/longitude • Input derived from maps by scanning or digitizing retains the original map's projection • With data from different sources, a GIS database often contains information in more than one projection, and must use conversion routines if data are to be integrated or compared
Integrating different data sources: issues • Scale • data may be input at a variety of scales • scale is an important indicator of accuracy • maps of the same area at different scales will often show the same features • variation in scales can be a major problem in integrating data
Integrating different data sources: issues • Resampling rasters • Raster data from different sources may use different pixel sizes, orientations, positions, projections • Resampling is the process of interpolating information from one set of pixels to another • Resampling to larger pixels is comparatively safe, resampling to smaller pixels is very dangerous
Representing Spatial Entities • The object-focused approach • Based on recognition of discrete objects or entities • May be layer-based or object-oriented • Usually represented by Vector GIS
Two ways of representing space in a GIS • The Tesseral (field-oriented) approach • Typically seen in Raster GIS • Also in some other models
Vector data models • Based on the recognition of discrete objects or entities • The location/boundaries of these objects defined with respect to some coordinate system • Emphasis is on boundaries, space within and between boundaries implied • Objects are usually defined in terms of points, lines and areas • Complex graphic objects are seen as amalgamations of simpler ones • Typical Vector GIS include ARC/INFO, MapInfo Intergraph MGE
The vector data model • Sequences of points can be used to define lines • Lines themselves can be aggregated to represent • Networks • Boundaries of polygons and regions • Topographic features (contours, breaks of slope, etc.).
Topology • An essential element of vector GIS • A distinct branch of mathematics • Defines spatial relationships between objects • Adjacency, connectivity, containment, etc. • Essential for most vector GIS operations
Advantages and disadvantages of the vector approach • Lower data volumes • More adaptable to variations in scale/resolution of phenomena • Tends to be more suited to social and economic applications • Disadvantages: • Less adaptable to uncertainty, fuzziness • Often no “lowest common denominator” of aerial unit .
Objects versus layers • Major point of discussion in GIS since mid-1980s • Alternative strategies for vector representation of geographic space • a “stacked” sequence of layers • a collection of discrete objects • Difference in how contents of the database represents the real world • Echoes wider developments in Computer Science
The Object view • More closely mirrors natural ways of seeing the world • Objects usually used in speaking, writing, thinking about the world • Objects are fundamental to our understanding of geography • Object-oriented approaches may offer data storage and processing advantages
What are these objects? • Graphics objects can be points, lines, areas • Geographic objects can be roads, houses, hills, etc. • A space can be occupied by many, or no, objects • A river is an object (has an identity, name, coordinates, properties, etc.) • A line is an object (also has an identity, name, coordinates, properties, etc.)
Applications of object view: • Utilities and facilities management • Concept of empty space littered with objects fits many needs of managing infrastructure • Two or more objects may occupy same horizontal position, separated vertically • Smaller objects may be part of larger ones (e.g. pipes as part of networks) and vice versa • Idea of a variable measured everywhere on Earth has little relevance
The Layer view • Locations specified by a system of coordinates • Geography of real world conceptualised as a series of variables (soils, land use, elevation, etc.) • Each layer in the database represents a particular variable
The Layer view • Layer view often more compatible with theories of atmospheric, ocean processes • Object view is less compatible with concept of continuous change • Good for resource management applications • Much data for environmental modelling derived from remote sensing • Implies a layer view
Disadvantages • The layer approach usually requires many different files to represent each layer • Some files contain the actual data • Some contain registration information • Some contain topological information to construct complex geometries from more primitive ones
Applications of layer view • Resource management • geographic variation can be described by relatively small amount of variables • conceptualisation reasonably constant between scales • movement of individuals can lead to difficulties of representation and tracking across layers
Tesseral geometries • From the Greek, tetara or Latintessella = a tile • Tessallations are “sets of connected discrete two-dimensional units” • thus mosaics or tilings of space • May be regular or irregular • Focus is on space occupancy • Emphasis is on areas, boundaries are implied
Types of tessallation Regular tessalations Rasters Irregular tessalations Quadtrees Voronoi Tessalations Triangulated Irregular Networks (TINs)
The raster • “Raster Data are spatial data expressed as a matrix of cells or pixels, with spatial positioning implicit in the ordering of the pixels” (AGI 1994) • Raster data structure widely used in GIS • e.g. IDRISI, GRASS, Arc/Info’s GRID module
Why use rasters? • Raster data from other disciplines • Ideal for representing continuous variations in space • Common way of structuring digital elevation data • Assumes no prior knowledge of the phenomenon • Uniform, regular sampling of reality
Why use rasters? • Often used as common data exchange format • Raster algorithms often simpler and faster • Easy to program, less need for special hardware • Raster systems tend to be cheaper than vector
Issues and trade-offs • May give very large data files • typical raster databases may contain > 100 layers • each layer typically contains hundreds or thousands of cells • Many options exist for storing raster data • some are more economical than others in terms of storage space • some more efficient in terms of access and processing speed
Issues and trade-offs • Maximum resolution determined by the size of grid • Less easy to connect tabular (attribute) data to spatial objects • Raster data lack topology • Regular geometry of raster cells may not accurately reflect the variations of reality
Variable-resolution tessalations • Triangulated Irregular Networks (TINs) • Alternative to regular raster for terrain modelling • Developed in 1970s • Can build surfaces from irregular arrays of point elevation data • Many commercial GIS now offer TIN capabilities.
Topic 4: Coordinates, Datums, and Projections
90º N Latitude Northern Hemisphere Eastern Hemisphere Equator 0º Latitude Prime Meridian 0º Longitude Western Hemisphere Southern Hemisphere 90º S Latitude 90º W Longitude 90º E Longitude 0º Longitude 180º Longitude Spherical Coordinates Spherical “grid” is called a graticule Latitude references north and south Longitude references east/west Line of constant latitude is a parallel Line of constant longitude is a meridian Meridiansconverge at the poles Latitude range: 0 to 90 degrees north and south Longitude range: 0 to 180 degrees east and west
Spherical Coordinates A spherical coordinate measure is expressed in degrees (º), minutes (‘) and seconds (“) 1º = 60’ = 3,600” ; 1’ = 60” Expressed as: ddd mm ss N/S, ddd mm sss E/W Note the convention is to express latitude (y) before longitude (x), but computer environments use x,y • In most digital environments, degrees, minutes and seconds are converted to decimal degrees: degrees + (min/60) + (sec/3600) • Harrisburg International Airport is: 40º12’N, 76 º45’W,or • 40.20N, 76.75W
Spherical Coordinates Western and Northern Hemisphere: -x, +y Eastern and Northern Hemisphere: +x, +y Western and Southern Hemisphere:-x, -y Eastern and Southern Hemisphere:+x, -y
(4.5, 4.5) 1 2 3 4 5 6 Y axis (2.0,3.0) (7.0,2.0) 0,0 1 2 3 4 5 6 7 8 9 X axis Cartesian Coordinates
NAD 1927 DATUM GRS80 Spheroid Meades Ranch Kansas Earth Center Clarke 1866 Center Clarke 1866 Spheroid Horizontal Datum • North American Datum of 1927 • A local datum centered on the Meades Ranch in Kansas. Surface of ellipsoid was tangent to the Meades Ranch • 300,000 permanent control network • Clarke 1866 spheroid used to define the shape and size of the earth NAD 1983 DATUM • North American Datum of 1983 • an earth centered datum where the center of the spheroid is the center of the earth • based on the Geodetic Reference System of 1980 (GRS80): a better approximation of earth’s true size and shape. • twice as accurate as the NAD27: resulted in controls shifted up to 100 meters Meades Ranch Kansas GRS80 Spheroid Earth Center Clarke 1866 Center Clarke 1866 Spheroid
Land Mass Sea Level Sea Floor Vertical Datum (mean sea level) Vertical Datum • National Geodetic Vertical Datum of 1929 • vertical datum based mean sea level as determined by years of observations at tidal gauging stations • 585,000 permanently monumented vertical benchmarks interconnected by leveling • North American Vertical Datum of 1988 • 1929 datum adjusted based on more precise measurements of geoid shape and mean sea levels. • some bench mark heights changed up to 2 meters, but heights between adjacent benchmarks changed < a few millimeters • provides better geoid height definitions in order to convert earth centered GPS derived heights
Projections To represent a spherical model of the earth on a flat plane requires a map projection! Projection