Automated Analysis of Pollen Tube Tip Profiles Using Gaussian Peak Identification
This study explores the automated identification of pollen tube tip profiles through advanced R scripting techniques. A comprehensive investigation into the complex morphologies of pollen tubes reveals that peaks on the tip profiles do not always align with maximum densities, challenging traditional analysis methods. Utilizing the Wall_1_Prep.R and Wall_2_dGauss.R scripts, we refine peak identification and analyze wall thickness and tip velocity through Gaussian fitting. By addressing shoulder peaks and variances in outer and inner base densities, we can enhance our understanding of pollen tube growth dynamics.

Automated Analysis of Pollen Tube Tip Profiles Using Gaussian Peak Identification
E N D
Presentation Transcript
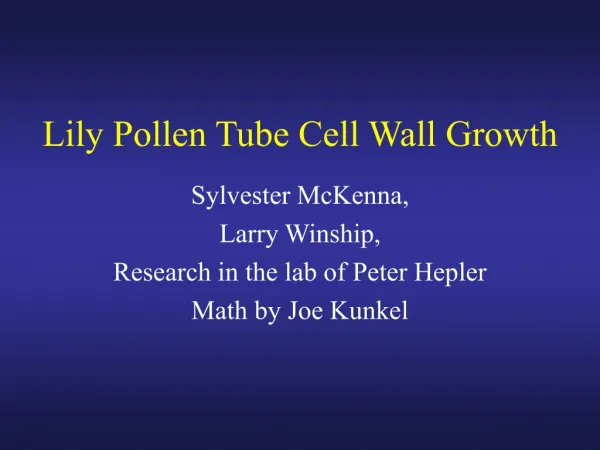
Lily Pollen Tube Cell Wall Growth Sylvester McKenna, Larry Winship, Research in the lab of Peter Hepler Math by Joe Kunkel
Pollen tube auto-peak-identification. • Growing tubes have 200+ image frames with600+ pixel length. Automation is a priority. • The tube tip profile does not always own the maximum density on the profile. • The profiles do not always have two distinct peaks associated with the outer and inner edge. How does one deal with shoulder peaks. • The outer base density differs from the inner base density.
Pollen tube axial profile tip ID: True tip profile. • In some tubes the maximum fringe is not the tip profile! • Auto-identification of tip profiles must deal with all cases. Spurious peak. True tip profile.
R scripting: • Wall_1_Prep.R • Initial peak identification allows 2 peaks to be given a peak pixel location. • Wall_2_dGauss.R • Peak refinement allows fractional pixel identification by fitting two Gausian curves to the DIC profile of the pollen tube tip wall. Shoulders on primary peaks can be identified as a Gaussian component. • Wall_3_Anal.R • Wall-thickness and Tip Velocity cross-correlation analysis.
back | < sets previous 10 profiles as current. fwd | > set next 10 profiles as current. 98% dx | - decrease the Y-axis focus span. 102% dx | + increase the Y-axis focus span. tog-5 | 5 shift span of profiles by 5. +2nd | 2 add or re-add a second peak. -2nd | 1 remove a second peak. no_force | 0 remove force on choosing a peak. goto | g go to any frame in the series. browse | b allows examining current variables. cntr | c allows choice of a new focus for a frame. sort | s does a sort of the peak orders for current. wid | w widen the X-axis pixel span. nar | n narrow the X-axis pixel span. abort | * close down the program. R script 1: Wall_1_Prep.R menu …
Input Requests the name of a ‘.log’ file. Asks if the log file is new. If not new, asks for a numeric suffix of prior output. Asks if an output in memory should be used/recovered. Asks for a numeric suffix to add to an output file. A menu allows character driven choice of changes to identifying pollen tube tip profile parameters: Identify a proximal profile peak pixel. Review auto-chosen peaks and allow changes. Produces an output file identified by a numeric suffix: Cols 2-3: peak-1 and peak-2 X-axis location in um. Cols 9,11: peak-1 and peak-2 integer pixel location. Cols 10,12: peak-1 and peak-2 standard deviation (1 by default) Col 7: 0, 1, 2 auto peaks or 3, a forced set of peaks. Col 8: 0, 1 indicates whether current means and SD are set. Col 4,5,6: F, D , Diff parameters for mixing Gaussian distributions. R script 1: Wall_1_Prep.R I/O
R-script 2: Wall_2_dGauss.R • Helps fit a pair of Gaussian distributions to the pollen tube DIC profile. • Menu allows changes to mean and SD of leading and trailing Gaussian distributions. • Ends with using means to estimate tip velocity and wall thickness.
Input Requests the name of a ‘.log’ file. Asks for a numeric suffix of prior output. Asks if an output in memory should be used/recovered. Asks for a numeric suffix to add to an output file. A menu allows character driven choice of changes to set pollen tube tip profile parameters: Identify profile peaks that need mean, SD, F and D adjustment. Allows inheritance of SD, F and D parameters from previous profile. Sets Col 8 to 1 when adjustments have been made. Produces an output file identified by a numeric suffix: Cols 2-3: peak-1 and peak-2 X-axis location in um. Cols 9,11: peak-1 and peak-2 integer pixel location. Cols 10,12: peak-1 and peak-2 standard deviation (1 by default) Col 7: 0, 1, 2 auto peaks or 3, a forced set of peaks. Col 8: 0, 1 indicates whether current means and SD are set. Col 4,5,6: F, D , Diff parameters for mixing Gaussian distributions. Each contour must be adjusted individually, thus a need for efficiency. R script 2: Wall_2_dGauss.R I/O Contour prior to fitting Contour after fitting
Protocol for fitting contours to a tip profile: • The means, u1 andu2, are preliminarily set as the center of the pixel identified as the peak of a DIC fringe. The SDs are preliminarily set to 1 for convenience. • Means, u1 andu2, and SDs are changeable in adjustable sub-pixel increments. • The joint contour is auto adjusted to coincide with the peak of the contour data with parameter F for visual display. • The relative contribution of peak 1 and 2 to the joint contour is adjustable in increments by parameter D to visually conform to data. • u1, SD1, u2, SD2, F and D are stored in an output matrix which can reproduce the predicted outline. • SDs, F and D are inheritable as an aid. • Wall Thickness is computed as u2-u1. Tip Velocity is computed from the positions of u1 in adjacent frames. Contour prior to fitting Contour after fitting
Wall_3_Anal.R: Wall thickness and Tip Velocity Sample output of Wall_Anal.R: • Original data fit with lowess(f=0.02) • Corrected by subtracting median with lowess(f=0.2)
Wall_3_Anal.R: Wall thickness and Tip Velocity …for data set 061506f … Sample output of Wall_Anal.R: A. B. • A. Auto-correlation of tip-velocity. • B. Cross-correlation of Tip-Velocity with Wall Thickness. • Shows that Tip Velocity follows Wall-Thickness peak but predicts the Wall-Thickness trough better. Is that significant and meaningful? • Are these conclusions generalizeable to other data sets?
Wall_3_Anal.R: Wall thickness and Tip Velocity …offset correlations for data set 061506f … A. Sample output of Wall_Anal.R: B. • A. Correlation of Tip-velocity preceding Wall thickness by 3-7 frame units. • B. Correlation of Tip-Velocity after Wall Thickness by 3-7 frame units. • Shows that Tip Velocity predicts Wall-Thickness, r2 = 0.44, but predicts the Wall-Thinness a bit better, r2= 0.59. Is that significant and meaningful? • Are these conclusions generalizeable to other data sets?
Andy.R: Wall thickness and Tip Velocity …ANOVA of set 061506f … Sample output of Andy.R: • Individually Velocity is correlated with Wall Thickness (-7 and +6) by (r = 0.66, -0.77). • Using both provides a better joint correlation of r = 0.80. • Wall-Thickness predicts Tip Velocity, r2= 0.64 which is better than the individual explanations (r2 = 0.44, 0.59). This is significant and meaningful! • Are these conclusions generalizeable to other data sets?
Andy.R: Wall thickness and Tip Velocity …ANOVA of set 061506f … Output of Andy.R: • Individually Velocity is correlated with Wall Thickness (-7 and +6) by (r = 0.66, -0.77) or (r2 = 0.44, 0.59). • Using both provides a better joint correlation of r = 0.80 or 64% of variability. • The effects are not visually or dramatically but are statistically significant. • Are these conclusions generalizeable to other data sets? (now have two sets consistent.)
Wall_3_Anal.R provided an output matrix: 061506fs.log2.out.csvof Velocity plus offset Wall Thickness data. The original Nframes of data needed to be trimmed by 7 lines at beginning and end to allow for offsets of the wall data in both directions. This data with a column of 1’s representing the mean was submitted to Andy.R and the equation V = u + Wth(-7) + Wth(+6) was evaluated. The contribution of the two Wall-Thickness offsets to predicting V were tested by subtraction and found to be both highly significant. The parameters of the equation were used to predict V and the result was found to explain 64% of the variability of V. Eventually 6-tubes data would be analyzed together. How Andy.R and was initially used
GAM analysis 1 • Formula: Velocity ~ s(Wp3) + s(Wp4) + s(Wp5) + s(Wp6) + s(Wp7) + s(Wm3) + s(Wm4) + s(Wm5) + s(Wm6) + s(Wm7) • Parametric coefficients: • Estimate Std. Error t value Pr(>|t|) • (Intercept) 0.001956 0.002167 0.903 0.368 • Approximate significance of smooth terms: • edf Est. rank F p-value • s(Wp3) 1.000 1 6.027 0.01498 * <- {1 df thus it does not need smooth) • s(Wp4) 2.327 5 3.053 0.01123 * <- • s(Wp5) 1.064 3 1.597 0.19140 • s(Wp6) 1.000 1 4.210 0.04155 * <- {1 df thus it does not need smooth) • s(Wp7) 1.672 4 1.926 0.10772 • s(Wm3) 2.038 5 1.422 0.21795 • s(Wm4) 3.597 8 2.752 0.00672 **<- • s(Wm5) 1.000 1 1.257 0.26368 • s(Wm6) 1.000 1 0.023 0.88051 • s(Wm7) 5.487 9 2.133 0.02855 * <- • --- • Signif. codes: 0 ‘***’ 0.001 ‘**’ 0.01 ‘*’ 0.05 ‘.’ 0.1 ‘ ’ 1 • R-sq.(adj) = 0.75 Deviance explained = 77.4% • GCV score = 0.0011155 Scale est. = 0.001005 n = 214 • Conclusion: Focus on the significant offsets (-7, -4, 3, 4, 6)!
GAM analysis 2 • Formula: Velocity ~ s(Wp3) + s(Wp4) + s(Wp6) + s(Wm4) + s(Wm7) • Parametric coefficients: • Estimate Std. Error t value Pr(>|t|) • (Intercept) 0.001956 0.002197 0.891 0.374 • Approximate significance of smooth terms: • edf Est.rank F p-value • s(Wp3) 1.000 1 6.943 0.00908 ** {1 df thus it does not need smooth) • s(Wp4) 2.531 6 3.245 0.00458 ** • s(Wp6) 1.052 3 8.940 1.39e-05 *** { ~1 df thus it does not need smooth?) • s(Wm4) 4.010 9 5.753 4.23e-07 *** • s(Wm7) 4.921 9 2.508 0.00968 ** • --- • Signif. codes: 0 ‘***’ 0.001 ‘**’ 0.01 ‘*’ 0.05 ‘.’ 0.1 ‘ ’ 1 • R-sq.(adj) = 0.743 Deviance explained = 75.9% • GCV score = 0.0011079 Scale est. = 0.0010327 n = 214
GAM analysis 3 • Formula: Velocity ~ s(Wp6) + s(Wm7) • Parametric coefficients: • Estimate Std. Error t value Pr(>|t|) • (Intercept) 0.001956 0.002581 0.758 0.449 • Approximate significance of smooth terms: • edf Est.rank F p-value • s(Wp6) 2.080 5 25.57 < 2e-16 *** • s(Wm7) 1.001 2 16.68 1.89e-07 *** • --- • Signif. codes: 0 ‘***’ 0.001 ‘**’ 0.01 ‘*’ 0.05 ‘.’ 0.1 ‘ ’ 1 • R-sq.(adj) = 0.645 Deviance explained = 65% • GCV score = 0.0014538 Scale est. = 0.001426 n = 214 • The model : Velocity ~ s(Wp6) + s(Wm7) + s(Wp6,Wm7)yielded no evidence of an interaction between the leading peak of Wall-Thickness and trailing trough.
GLM and GAM correlations Data set 061506f: • R Vo Ve pGpG2 pG3 • Vo 1.000 0.844 0.8800.871 0.806 all offsets • Ve 0.844 1.000 0.975 0.972 0.944 (-7, -4 , 3, 4, 6) • pG 0.880 0.975 1.000 0.993 0.930 • pG2 0.871 0.972 0.993 1.000 0.934 • pG3 0.806 0.944 0.930 0.934 1.000 • R2Vo Ve pG pG2 pG3 • Vo 1.000 0.713 0.7740.759 0.650 • Ve 0.713 1.000 0.951 0.945 0.891 • pG 0.774 0.951 1.000 0.987 0.865 • pG2 0.759 0.945 0.987 1.000 0.873 • pG3 0.650 0.891 0.865 0.873 1.000
Wall thickness and Tip Velocity … // GLM on set 061506f … then GAM / Output of GAM/\ vs GLM /\/\ : • Individually Velocity is correlated with Wall Thickness, (-7 and +6) by (r = 0.66, -0.77). • Using both provides a better joint correlation of r = 0.80 (r2=0.64) above in red. • Knowledge of Wall Thickness explains substantial amounts of the variation of Tip Velocity. • The general additive model (GAM) achieves an r =0.88 (r2=0.77) using 10 Wall Thickness offsets. An r =0.87 (r2=0.76) using 5 Wall Thickness offsets (-7, -4 , 3, 4, 6).
Velocity and Wall-thickness offset data from 6 tubes were combined into one data + design matrix. Analysis of dispersion script andy.R was used to fit Velocity to Wall-Offset and pollen-tube specific effects: Vmi = u + WTpj + WTmk + tubem i = image frame 1…Nm j = Wall thicknesses offset plus direction k = Wall thicknesses offset mins direction m = Pollen tube #, 1…6. Nm = Number of image frames in tube m. Since these items are all correlated, they must be analyzed by subtraction from a joint reduction of Velocity Sums of Squares. Wall thickness as measured physically and by PI fluorescence can each be measured in what sense they can predict Tip Velocity. Analysis of 6 tube data via GLM
> t(Xdes[N1,12:16])%*%Xdes[N1,12:16] Tube1 Tube2 Tube3 Tube4 Tube5 Tube1 210 0 0 0 0 Tube2 0 0 0 0 0 Tube3 0 0 0 0 0 Tube4 0 0 0 0 0 Tube5 0 0 0 0 0 > t(Xdes[N2,12:16])%*%Xdes[N2,12:16] Tube1 Tube2 Tube3 Tube4 Tube5 Tube1 0 0 0 0 0 Tube2 0 187 0 0 0 Tube3 0 0 0 0 0 Tube4 0 0 0 0 0 Tube5 0 0 0 0 0 > t(Xdes[N3,12:16])%*%Xdes[N3,12:16] Tube1 Tube2 Tube3 Tube4 Tube5 Tube1 0 0 0 0 0 Tube2 0 0 0 0 0 Tube3 0 0 210 0 0 Tube4 0 0 0 0 0 Tube5 0 0 0 0 0 > t(Xdes[N4,12:16])%*%Xdes[N4,12:16] Tube1 Tube2 Tube3 Tube4 Tube5 Tube1 0 0 0 0 0 Tube2 0 0 0 0 0 Tube3 0 0 0 0 0 Tube4 0 0 0 210 0 Tube5 0 0 0 0 0 > t(Xdes[N5,12:16])%*%Xdes[N5,12:16] Tube1 Tube2 Tube3 Tube4 Tube5 Tube1 0 0 0 0 0 Tube2 0 0 0 0 0 Tube3 0 0 0 0 0 Tube4 0 0 0 0 0 Tube5 0 0 0 0 210 > t(Xdes[N6,12:16])%*%Xdes[N6,12:16] Tube1 Tube2 Tube3 Tube4 Tube5 Tube1 210 210 210 210 210 Tube2 210 210 210 210 210 Tube3 210 210 210 210 210 Tube4 210 210 210 210 210 Tube5 210 210 210 210 210 Tube data sample sizes: N1= 210, N2= 187, N3= 210, N4= 210, N5= 210, N6= 210
Design Matrix X: Independent Vars ßMean WTp3 WTp4 WTp5 WTp6 WTp7 WTm3 WTm4 WTm5 WTm6 WTm7 Tube1 Tube2 Tube3 Tube4 Tube5 • [1,] 1 -68 -41 -10 18 50-44 -34 31 -11 43 1 0 0 0 0 • [2,] 1 -41 -10 18 5029-14-44 -34 31 -11 1 0 0 0 0 • [3,] 1 -10 18 5029 78 -53 -14-44 -34 31 1 0 0 0 0 • [4,] 1 18 5029 78 113 -67 -53 -14-44 -34 1 0 0 0 0 • [5,] 1 5029 78 113 172 -76 -67 -53 -14-44 1 0 0 0 0 • [6,] 1 29 78 113 172 130 -74 -76 -67 -53 -14 1 0 0 0 0 • [7,] 1 78 113 172 130 71 -68 -74 -76 -67 -53 1 0 0 0 0 • [8,] 1 113 172 130 71 102-41 -68 -74 -76 -67 1 0 0 0 0 • [9,] 1 172 130 71 102 84 -10 -41 -68 -74 -76 1 0 0 0 0 • [10,] 1 130 71 102 84 102 18 -10 -41 -68 -74 1 0 0 0 0 • [11,] 1 71 102 84 102 146 50 18 -10 -41 -68 1 0 0 0 0 • [12,] 1 102 84 102 146 99 29 50 18 -10 -41 1 0 0 0 0 • [13,] 1 84 102 146 99 58 78 29 50 18 -10 1 0 0 0 0 • [14,] 1 102 146 99 58 42 113 78 29 50 18 1 0 0 0 0 • [15,] 1 146 99 58 42 15172 113 78 29 50 1 0 0 0 0 • [16,] 1 99 58 42 15 -10 130 172 113 78 29 1 0 0 0 0 • [17,] 1 58 42 15 -10 -12 71 130 172 113 78 1 0 0 0 0 • [18,] 1 42 15 -10 -12 -31 102 71 130 172 113 1 0 0 0 0 • [19,] 1 15 -10 -12 -31 -62 84 102 71 130 172 1 0 0 0 0 • [20,] 1 -10 -12 -31 -62 -5 102 84 102 71 130 1 0 0 0 0 Velocity = X ß + error E[Velocity] = X ß
R-prompt plotting of 6 Velocity curves > par(mar=c(0.1, 0.1, 0.1, 0.1) + 0.1) # reduces margins > layout(matrix(c(1:6), 6, 1, )) # creates multi-plot layout > plot(Velocity[N1], typ='p') # plot tube 1 data > lines(EVel[N1], typ='l', lwd=3) # add expected tube 1 line > plot(Velocity[N2], typ='p') # … > lines(EVel[N2], typ='l', lwd=3) > plot(Velocity[N3], typ='p') > lines(EVel[N3], typ='l', lwd=3) > plot(Velocity[N4], typ='p') > lines(EVel[N4], typ='l', lwd=3) > plot(Velocity[N5], typ='p') > lines(EVel[N5], typ='l', lwd=3) > plot(Velocity[N6], typ='p') > lines(EVel[N6], typ='l', lwd=3)
E[Velocity] = X ß, R = 0.749, R2 = 0.561 Tip velocity is fit by a common function of prior and succeeding wall-thicknesses. 061406q 061506c 061506e 061506f 061506l 061506m
Velocity and Wall-thickness offset data from 6 tubes were combined into one data + design matrix. require(mgcv): Vmi ~ s(WTpj) + s(WTmk) + tubem i = image frame 1…Nm j = Wall thicknesses offset in plus direction k = Wall thicknesses offset in minus direction m = Pollen tube #, 1…6. Nm = Number of image frames in tube m. Since these items are all correlated, they must be analyzed by subtraction from a joint reduction of Velocity Sums of Squares. Wall thickness as measured physically and by PI fluorescence can each be measured in what sense they can predict Tip Velocity. There is no significance to different pollen tubes in predicting tip velocity in either GLM or GAM analysis!! Ergo, it is a very uniform process!!! Rscript to compare GAM to GLM fit: source("Velo-WTglm+WTgam.R") Formula: Velocity ~ s(WTp3) + s(WTp4) + s(WTp5) + s(WTp6) + s(WTp7) + s(WTm3) + s(WTm4) + s(WTm5) + s(WTm6) + s(WTm7) + Tube1 + Tube2 + Tube3 + Tube4 + Tube5 Parametric coefficients: Estimate Std. Error t value Pr(>|t|) (Intercept) 0.001402 0.001489 0.942 0.346 Tube1 -0.003875 0.003468 -1.118 0.264 Tube2 0.003306 0.003983 0.830 0.407 Tube3 0.002695 0.003435 0.785 0.433 Tube4 -0.003875 0.003468 -1.118 0.264 Tube5 0.001558 0.003357 0.464 0.643 Approximate significance of smooth terms: edf Est.rank F p-value s(WTp3) 5.040 9 5.775 6.93e-08 *** s(WTp4) 5.164 9 4.150 2.77e-05 *** s(WTp5) 1.000 1 6.281 0.01234 * s(WTp6) 4.348 9 2.049 0.03131 * s(WTp7) 7.188 9 2.533 0.00704 ** s(WTm3) 6.520 9 4.826 2.37e-06 *** s(WTm4) 1.000 1 1.780 0.18238 s(WTm5) 5.287 9 2.620 0.00533 ** s(WTm6) 8.557 9 4.061 3.80e-05 *** s(WTm7) 5.922 9 3.009 0.00148 ** --- Signif. codes: 0 ‘***’ 0.001 ‘**’ 0.01 ‘*’ 0.05 ‘.’ 0.1 ‘ ’ 1 R-sq.(adj) = 0.601 Deviance explained = 61.8% R = 0.786 GCV score = 0.002865 Scale est. = 0.0027353 n = 1237 Analysis of 6 tube data via GAM
E[Velocity] = GAM(X), R = 0.786, R2 = 0. 618 Tip velocity is fit by GAM(wall-thicknesses+tube#) and compared to GLM. 061406q 061506c 061506e 061506f 061506l 061506m
Fixes of Wall R-scripts 0.9: Added memory of a recent log file. Added output of a CSV file of Velocity and offset Wall thicknesses used to analyze the prediction of Velocity using andy.R and GAM. Problem with sort routine when reloading an output file. Needed to be loaded as.matrix() rather than as a data frame. Notes on R-scripts