Intro to ArcGIS
1.03k likes | 1.22k Vues
Intro to ArcGIS. Kate Dougherty, Geosciences & Maps Librarian Tutorial created for version 10.1 in February 2013. Overview. What is GIS? Common uses Software Interface & navigation Adding layers Customizing & displaying layers. Select features by attribute Select features by location

Intro to ArcGIS
E N D
Presentation Transcript
Intro to ArcGIS Kate Dougherty, Geosciences & Maps Librarian Tutorial created for version 10.1 in February 2013
Overview • What is GIS? • Common uses • Software • Interface & navigation • Adding layers • Customizing & displaying layers • Select features by attribute • Select features by location • Buffer features tool • Layout view • Datums & projections • File management • Data sources
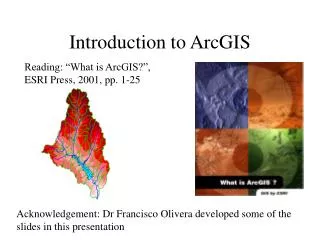
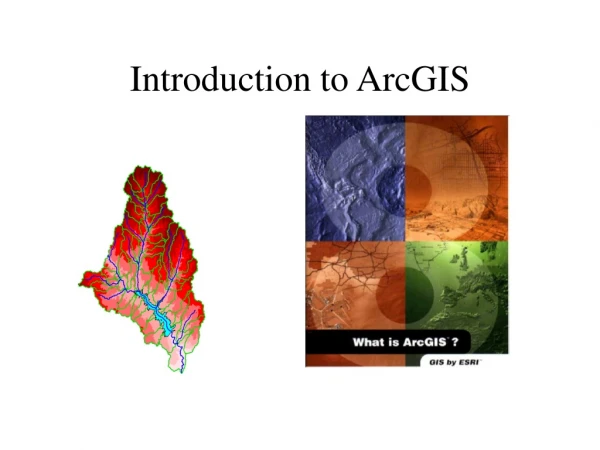
What is GIS? • Geographic Information Systems (GIS) is a computer-based methodology for collecting, managing, analyzing, modeling, and presenting geographic or spatial data. • Allows you to overlay datasets and query them in terms of their spatial relation to each other
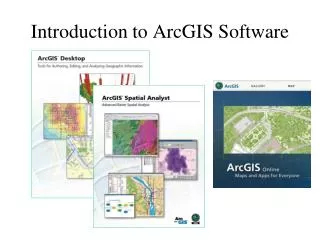
Two Types of Spatial Data • Raster - continuous data • E.G., air photos, scanned maps, elevation layers • Most remote sensing data is raster data • Vector - discrete features • A layer comprised of individual points, lines or polygons (e.g., roads or states) • This presentation focuses on vector data
Common Uses • Analyzing potential environmental hazards • Emergency services planning and routing • Siting new facilities: • wind farms • power plants • vineyards • Identifying food deserts in urban areas • Much more!
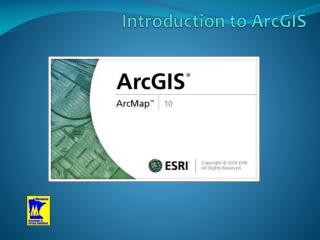
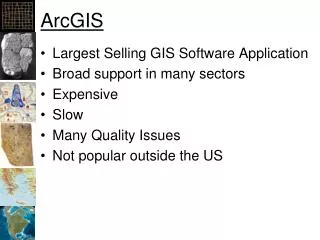
Esri • Environmental Systems Research Institute • ESRI is now Esri • Industry leader for GIS software • Program is ArcGIS/ArcMap • Now up to version 10.1. • (This presentation done with V. 10)
Table of contents that shows the doc’s layers. The “data frame” that displays the spatial data.
Identify feature Go to full map extent Go to next extent Go to previous extent Select features (by hand) Select elements (to move or edit) Clear selected features Add data
Project: Identify Washington County Parcels Near Perennial Streams
Add Layers • States (Census Bureau) • Counties (Census Bureau) • Hydrography (Area - National Hydrography Dataset) • Parcels (Washington County – Wash_Co_Data_Month_Year.zip) • Public lands (GeoStor)
Coordinate Systems • All your layers may not necessarily use the same coordinate system. • OK to draw and display • Not OK for detailed analysis (need to reproject layers – advanced step) • Data frame will use the coordinate system of the first layer that’s added • (displays feet, meters, or decimal degrees/lat/long of cursor location in bottom-right corner, depending on coordinate system)
Rename States Layer State layer renamed
Customizing Layers Select by Attribute Tool
Changing the Display of Layers • Change symbology/colors • Turn individual layers on or off • Change the display order • Layers on map display according to their order in the table of contents • Top layers may hide features in layers under them • Click & drag a layer in the table of contents to change its display order on the map
Clip Streams to Washington County Clip Tool