High-Resolution AFM Imaging of Mucin Interactome Organization
60 likes | 86 Vues
Explore topographical features of mucins and associated proteins from HBE cells in a detailed AFM image. Discover the organizational framework of purified MUC5B with 3D renderings. Uncover protein pathways with Ingenuity Pathway Analysis.

High-Resolution AFM Imaging of Mucin Interactome Organization
E N D
Presentation Transcript
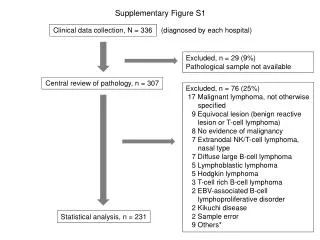
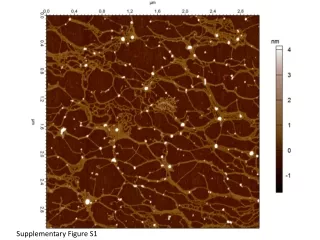
Supplementary figure S1: A raw topographical high resolution AFM image of the mucin interactome, mucins and their associated proteins, derived from HBE cells deposited on a mica surface. Mucins can be seen as the long fibers, both in individual and clustered configurations, while other proteins, as well as the hydrophobic non-glycosylated regions of the mucins, appear as circular nodes with different heights and sizes. A 3 dimensional rendering of this image, as well as detailed information can be found in figure 3. The height scale on the right is capped at 4 nm to emphasize the difference between glycosylated and protein regions of mucins, and other proteins. Features in bright white range in height from 4-14 nm.
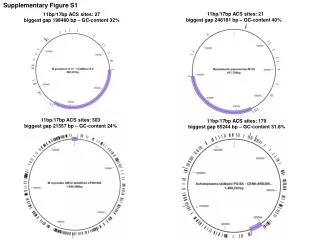
Supplementary figure S2: A 3-dimensional rendering of an Atomic Force Microscope image of the organizational framework of the purified MUC5B: MUC5B was isolated as essentially described previously (ref 16, 43) under dissociative conditions and deposited onto mica and observed in the Cypher AFM. Glycosylated domains/chains of the mucins are shown in green and measure approximately 1 nm in height. The brown coloring represents protein regions of the framework and mostly consist of the naked protein domains of the mucins. Although the mucin was highly purified, there may be residual proteins that covalently interact with the mucin’s protein domains on the brown nodes. As compared to Figure 3, the number of brown protein nodes are significantly reduced, and the mucin network is more uniform and linear with almost no clustering and no compact form present. Scale bar 250 nm.
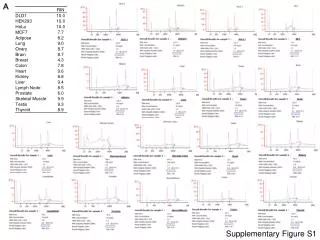
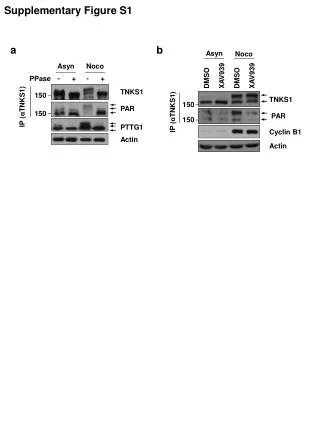
Supplemenatry Figure S3. The pathways in which the proteins in the mucin interactome are involved, as demonstrated by the Ingenuity Pathway analysis: Of the 66 proteins detected, the application used 56 to generate nine networks that we were able to merge including the networks Cell-To-Cell Signaling and Interaction, Tissue Development, Cellular Movement, Cell Death and Survival, Cell Signaling, Molecular Transport, Inflammatory Disease, and Inflammatory Response networks. We highlighted the mucin and mucin-like proteins with magenta, the exosomal proteins with light blue and the mucin interactome proteins with orange. The white proteins are the proteins that interacted with our data set. The different protein shapes suggest different protein functions. We used the default molecule shapes except for the enzymes, to which we have assigned a pentagonal shape. Magenta: Mucins, Blue: exosomal/vesicular proteins, Orange: mucin interactome, White: putative interacting proteins of mucin-interactome