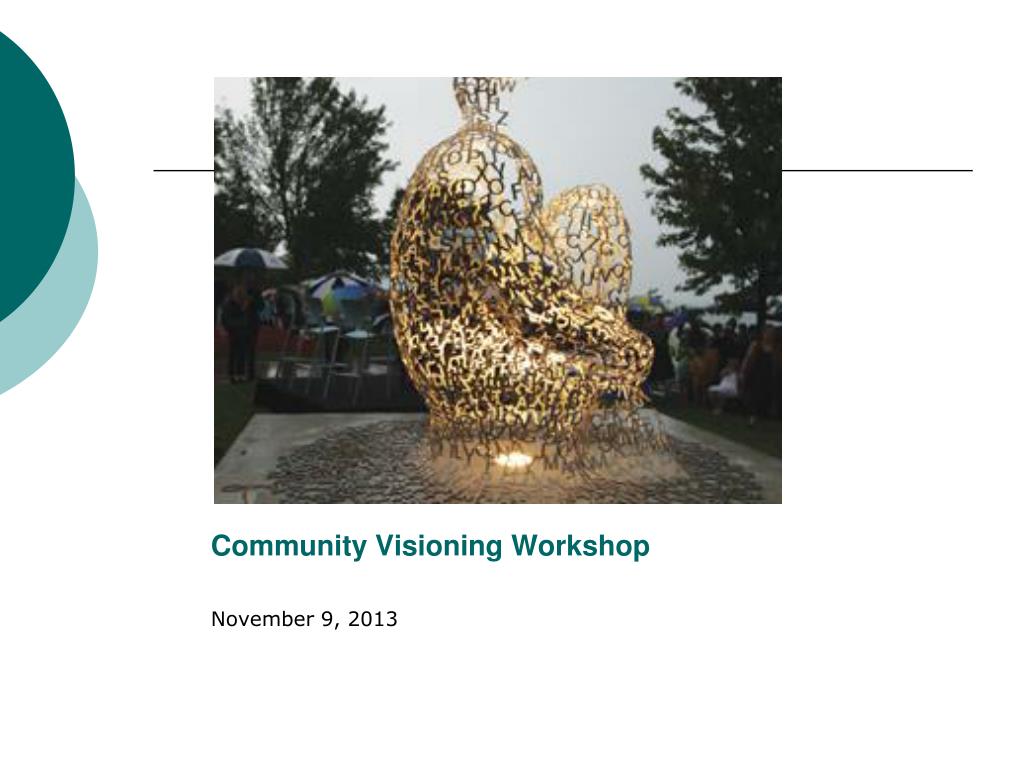
Community Visioning Workshop November 9, 2013
Community Visioning WorkshopWelcome! Shorewood Vision Projects 2005: Vision for 2015 2009 Update 2013-14 Vision for 2025
Vision Statement- 1 A vibrant urban community with safe, friendly neighborhoods offering a range of well-maintained housing options which reflect Shorewood’s architectural heritage.
Vision Statement - 2 Shorewood will be a desirable community that continues to attract and retain residents who value Shorewood’s community assets and rich diversity.
Vision Statement - 3 A model community that welcomes broad citizen participation in civic decision-making and is governed with a long-range, disciplined view of the future of Shorewood.
Vision Statement - 4 An attractive community with strong property values and a competitive tax rate; well-maintained public infrastructure; quality, cost-effective, and valued Village services; and outstanding staff members who use collaboration, innovation, and technology to optimize productivity and service excellence.
Vision Statements – 5 & 6 An ecologically-responsible community with a commitment to protecting the environment. A thriving community with a mix of attractive stores and services in a robust and profitable commercial center.
Vision Statement – 7 A well-educated community in which public and other educational assets are cultivated in a spirit of collaboration to achieve excellence.
Promote vibrant urban housing Protect & enhance property values Deliver quality services at a competitive tax rate Maintain a safe, walkable, small-town urban living experience Remain committed to open, interactive communication Protect & enhance our environment Protect & enhance public green spaces Collaborate to promote educational excellence Implementation Plan Goals
Marketing Vision Statement Shorewood is generally understood to be the most desirable area in Metro Milwaukee in which to live, raise a family, and locate a business.
Are we “There” yet?What does the data say?
We have new neighbors. (Percent of Householders, 2010 Census) • 2000’s: 65.3% • 1990’s: 18.5% • 1980’s: 9.0% • 1970’2: 3.8% • <1970: 3.4%
The Population Has Changed Some
Not much change in households 2000 Census • 49% of HH are NOT families • 25% of family HH have children <18 • 40% live alone • 52% are renters 2010 Census • 51.3% of HH are NOT families • 22.6% of family HH have children <18 • 39% live alone • 53% are renters
Change our Children% Change 2000 to 2010
School Age 1990 to 2010
School age: US, WI, & Shorewood
Change in Adults% Change 2000 to 2010
Ages 55-64 1990 to 2010
US Historical Context
US Projection: 2015-2060
Who Will Be Living in Shorewood? • National trends • Wisconsin “stickiness” • Milwaukee MSA
Will They Choose to Rent or Own? • Renters • Many ages/ stages • Owners • 1st time home buyer: 30-32 • 2nd time home buyer: 42
Renters and Owners – 2010
Architectural Heritage (Typical from NAHB) Typical New - 1900 Typical New - 1950 1,000 SF or less 2 bedrooms 1 bathroom One story 815 homes built in Shorewood during 1950’s • 700-1,200 SF • 2-3 bedrooms • 0-1 bathroom • Two stories 3,642 homes built in Shorewood <1940
Typical New Home - 2000 (from NAHB) • 2,265 SF • 3 or more bedrooms • 2 ½ bathrooms • Garage for 2+ cars • Center A/C • 1 Fireplace • Two stories 146 new in Shorewood
Typical New in 2012 (from NAHB) • 2,226 SF (median) • 2,494 for 35 and under • 2,065 for 65 and older • 2,150 SF (Midwest suburb) • 3 bedrooms/2.5 baths • Dining room • 3 add’l rooms (9.5 total) • Garage & A/C • Shopping w/in 15 min.
Typical in Shorewood (of 6,619) • Units with 9+ rooms: 789 • Median # rooms: 5.3 • 3,695 w/ 1-2 BR • 2,438 w/ 3-4 BR • 301 w/ 5+ BR
Typical in Shorewood (of 6,619) • 2,555 units are SF detached (39%) • 1,880 are in 20+ unit buildings (28%) • 1,119 are two units attached (17%)
Is our “There” still reasonable?What does the data say? • Vibrant urban housing • Protect/enhance property values • Attract families with children
Home Value Strengthening % Change 2000-10
Median Rent Strengthening Some% Change 2000-10
2013 Entrance/Exit Survey • 57% rent then buy • From MKE, out of state • Considered Mke, Tosa, Whitefish Bay Jobs & schools Taxes, COL, parking
Who we are attracting? Why?ESRI Tapestry Segmentation
Gazing into the future What should our tapestry segments look like in 2023? How can we become more desirable to priority groups? How do we move from “Good” and “Great” to BEST?
2013 Community Survey • Taxes up to rate of inflation • Parking ease • Home: 3.4 • Night: 3.1 • Business: 2.6 • Support sewer improvements
Knight Soul of the Community 2010 Why People Love Where They Live and Why It Matters: A National Perspective “Over the past three years, the Soul of the Community study has found a positive correlation between community attachment and local GDP growth.” (Knight Soul of the Community, 2010)
“Best Place to Live” Jobs Cost of living Sunshine Education Air/water quality Healthcare costs Crime rate Daily commute time Auto costs Leisure amenities Sperling Indices
Measures of Strength/Desirabilityby Rebecca Ryan • Vitality • Earning • Learning • Social Capital • After Hours • Cost of Lifestyle • Around Town
Knight Soul of the Community 2010 “…the same items rise to the top, year after year: • Social Offerings — Places for people to meet each other and the feeling that people in the community care about each other • Openness — How welcoming the community is to different types of people, including families with young children, minorities, and talented college graduates • Aesthetics — The physical beauty of the community including the availability of parks and green spaces” (Knight, 2010) http://www.soulofthecommunity.org/sites/default/files/OVERALL.pdf
Best Place to Live? What can we do? What should we do? What must we do? Personal sphere Government sphere Let’s get started!
Vitality Earning Learning Social Capital After Hours Cost of Lifestyle (Getting) Around Town Social Offerings Openness Aesthetics Jobs Cost of living Sunshine Education Air/water quality Healthcare costs Crime rate Daily commute time Auto costs Leisure amenities Challenges: Sewers, parking, taxes/fees, alleys…. Best Place to Live: Vibrant Urban Living Ideas/Priorities