Download
1 / 20
200 likes | 430 Vues
Physiology of the Circulatory System AP Biology Lab 10. Kit Information. AP Biology Lab # 10- Physiology of the Cardiovascular System Carolina # 74-6580 $299.00 32 students working in groups of 4 3 Activities Measuring Blood Pressure (30-40 minutes) Testing Physical Fitness (40 minutes)

E N D
Kit Information • AP Biology Lab # 10- Physiology of the Cardiovascular System • Carolina # 74-6580 • $299.00 • 32 students working in groups of 4 • 3 Activities • Measuring Blood Pressure (30-40 minutes) • Testing Physical Fitness (40 minutes) • Heart Rate of Daphnia (30-40 minutes)
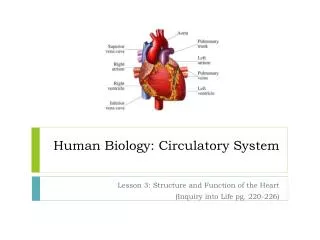
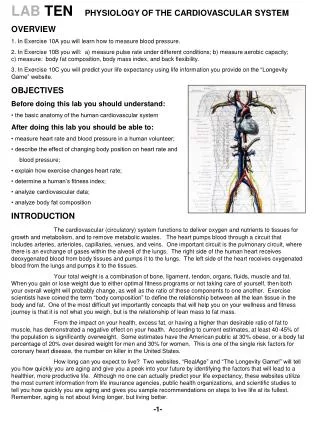
Objectives • Use a sphygmomanometer and stethoscope to measure systolic and diastolic blood pressure • Observe the response of the human circulatory system to various factors and use the results to determine the subject’s level of physical features • Investigate the relationship of temperature and heart rate of an ectotherm
Measuring Blood Pressure Background Information • Ventricle contraction forces blood from heart into arteries and causes increase in blood pressure • As ventricles relax blood pressure drops • Systolic blood pressure- highest pressure reached in cycle • Diastolic blood pressure- lowest pressure reached • Barorecpetors located in cartoid arteries and aortic arch constantly monitor blood pressure and send nerve impulses to the brain, which then controls the pressure to meet the needs.
Measuring Blood Pressure • Work in groups of 4 • One member will serve as test subject • One member will serve as examiner • One member will serve as data recorder • One member will serve as timer • You will switch roles and repeat the activitiy. • You must serve as each role!
Timing is important, read all instructions before beginning the activity! • Test subject should be sitting with sleeve rolled up • Experimenter should • Clean earpieces of the stehoscope with an alcohol swab before and after use • Never leave an inflated cuff on anyone’s arm for more than a few seconds
Inspect the sphygmomanometer. Be certain the exhaust valve is open and that the cuff is completely deflated. • Wrap the cuff snuggly, but not tightly, around the upper arm 2 to 3 cm above the bend of the elbow. • Place the bell of the stethoscope directly below the cuff in the bend of the elbow. • Close the exhaust valve of the bulb (pump) and rapidly inflate the cuff by squeezing the bulb until the pressure gauge goes past 200 mm Hg.
5. Open the exhaust valve just enough to allow the pressure to drop slowly, by the about 2-5 mm Hg/sec. 6. As the pressure falls, listen with the stethoscope for the first appearance of a clear thumping or tapping sound. The pressure at which you first hear this sound is the systolic pressure. Record the systolic pressure in Table 1. 7. Continue to listen as the pressure falls. The sound will become muffled and then louder. When the sound disappears, note the pressure. Record this measurement in Table 1 as the diastolic pressure.
8. Open the exhaust valve to completely deflate the cuff. Allow the subject to relax for 30 to 60 seconds before preceeding. 9. Repeat steps 1 through 8 two more times, to compete trials 2 and 3. Determine the subject’s average systolic and diastolic pressures.
Testing Physical Fitness Background Information • Maximum heart rate= 220 minus your age • Target heart rate = 50-70% your maximum heart rate
Testing Physical Fitness • Work in groups of 4 with the same roles you had in Part A • Test 1 involves taking systolic pressure with a sphygmomanometer • The other tests require taking the pulse rate • Pulse rate can be taken at the wrist
Test 1: Systolic Blood Pressure from Reclining to Standing Test 2: Standing Pulse Rate Test 3: Reclining Pulse Rate Test 4: Pulse Rate from Reclining to Standing Test 5: Step Test Each test will be scored. The scores of all 5 test will be add together to create a fitness score.
Heart Rate of Daphnia Background Information • The metabolism of many animals does not tenable them to maintain a constant body temperature independent of their environment. Such animals are ectotherms. From approximately 5oC to 35oC, the rate of metabolism in the animals increases as environmental temperature increase.
Daphnia Facts • small crustaceans commonly found in freshwater ponds and lakes. • use their large antennae to propel themselves forward. • Known as water fleas • Transparent and all internal organs are visible
Heart Rate of Daphnia • Obtain two concave-depression well slides. Place the slides side-by-side on your workspace with their concavities facing up. • Add a Daphnia to the concavity of one slide, in a small volume of culture fluid. • Pick up the second depression slide and flip it over. Place this slide, concavity side down, on top of the first slide so that their matching concavities form a shallow pool that holds the Daphnia. Use rubber bands to secure the slides together tightly.
4. Place the combined slides in a petri dish. Place the dish on the stage of a stereomicroscope. 5. Observe the Daphnia. Identify and note the position of the organism’s heart, dorsal to the intestine. 6. Use a cup or beaker to obtain a sample of room temperature water. Record the water temperature in Table 3. Slowly pour water into the petri dish until the bottom of the dish is covered. Stop before water covers the top of the upper slide.
7. Working together, one student should count heartbeats while another keeps time. Count the heartbeat for 10 seconds and record the data in Table 3. 8. Discard the water in the petri dish. 9. Obtain a sample of water with a different temperature. Repeat steps 6 through 8 using water with a different temperature each time. Continue until you have tested water from all the water baths or you reach a temperature at which the heart beats too rapidly for you to count.
10. For each water temperature, determine heart rate in beats per minute and record the data in Table 3.