Download
1 / 36
360 likes | 390 Vues
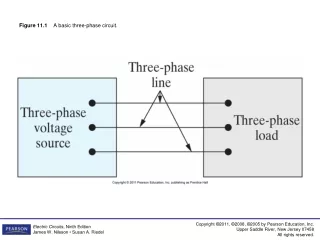
Learn about balanced three-phase systems, phasor diagrams, power calculations, and single-phase equivalent circuits. Explore the connections, voltages, loads, and wattmeter features in-depth.

E N D
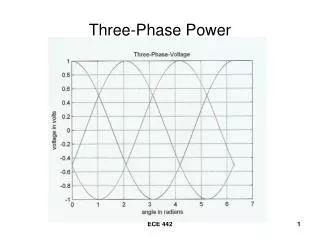
Figure 11.2 Phasor diagrams of a balanced set of three-phase voltages. (a) The abc (positive) sequence. (b) The acb (negative) sequence.
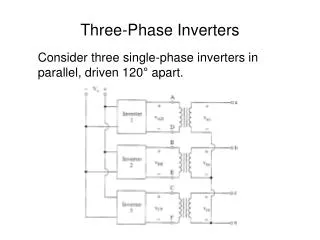
Figure 11.4 The two basic connections of an ideal three-phase source. (a) A Y-connected source. (b) A -connected source.
Figure 11.5 A model of a three-phase source with winding impedance: (a) a Y-connected source; and (b) a -connected source.
Figure 11.9 Phasor diagrams showing the relationship between line-to-line and line-to-neutral voltages in a balanced system. (a) The abc sequence. (b) The acb sequence.
Figure 11.10 The single-phase equivalent circuit for Example 11.1.
Figure 11.12 A circuit used to establish the relationship between line currents and phase currents in a balanced load.
Figure 11.13 Phasor diagrams showing the relationship between line currents and phase currents in a -connected load. (a) The positive sequence. (b) The negative sequence.
Figure 11.14 The single-phase equivalent circuit for Example 11.2.
Figure 11.15 A balanced Y load used to introduce average power calculations in three-phase circuits.
Figure 11.16 A -connected load used to discuss power calculations.
Figure 11.17 The single-phase equivalent circuit for Example 11.5.
Figure 11.18 The key features of the electrodynamometer wattmeter.
Figure 11.19 A general circuit whose power is supplied by n conductors.
Figure 11.20 A circuit used to analyze the two-wattmeter method of measuring average power delivered to a balanced load.
Figure 11.21 A substation connected to a power plant via a three-phase line.
Figure 11.22 A single phase equivalent circuit for the system in Fig. 11.21.