Chapter 6 Continuous Probability Distributions
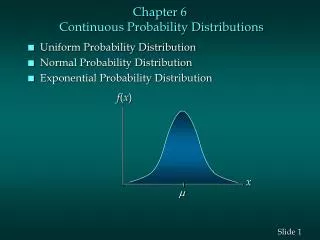
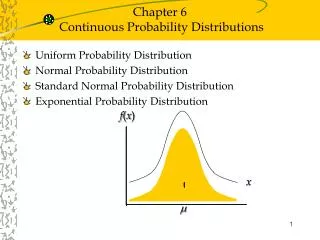
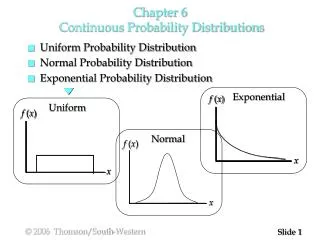
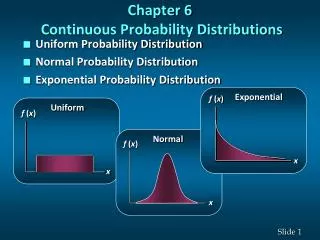
Exponential. f ( x ). Uniform. f ( x ). Normal. f ( x ). x. x. x. Chapter 6 Continuous Probability Distributions. Uniform Probability Distribution. Normal Probability Distribution. Exponential Probability Distribution. Normal Probability Distribution.

Chapter 6 Continuous Probability Distributions
E N D
Presentation Transcript
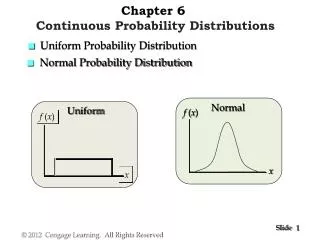
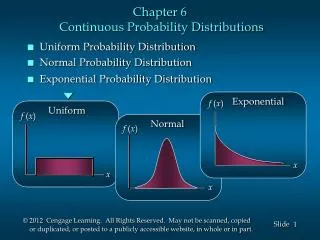
Exponential f (x) Uniform f (x) Normal f (x) x x x Chapter 6 Continuous Probability Distributions • Uniform Probability Distribution • Normal Probability Distribution • Exponential Probability Distribution
Normal Probability Distribution • The normal probability distribution is the most important distribution for describing a continuous random variable. • It is widely used in statistical inference. • It has been used in a wide variety of applications including: • Heights of people • Rainfall amounts • Test scores • Scientific measurements • Abraham de Moivre, a French mathematician, published The Doctrine of Chances in 1733. • He derived the normal distribution.
Normal Probability Distribution • Characteristics The distribution is symmetric; its skewness measure is zero. x
Normal Probability Distribution • Characteristics The entire family of normal probability distributions is defined by itsmeanm and its standard deviations . Standard Deviation s x Mean m
Normal Probability Distribution • Characteristics The highest point on the normal curve is at the mean, which is also the median and mode. x
Normal Probability Distribution • Characteristics The mean can be any numerical value: negative, zero, or positive. x -10 0 25
Normal Probability Distribution • Characteristics The standard deviation determines the width of the curve: larger values result in wider, flatter curves. s = 15 s = 25 x
Normal Probability Distribution • Characteristics Probabilities for the normal random variable are given by areas under the curve. The total area under the curve is 1 (.5 to the left of the mean and .5 to the right). .5 .5 x
Normal Probability Distribution • Characteristics (basis for the empirical rule) of values of a normal random variable are within of its mean. 68.26% +/- 1 standard deviation of values of a normal random variable are within of its mean. 95.44% +/- 2 standard deviations of values of a normal random variable are within of its mean. 99.72% +/- 3 standard deviations
99.72% 95.44% 68.26% Normal Probability Distribution • Characteristics (basis for the empirical rule) x m m + 3s m – 3s m – 1s m + 1s m – 2s m + 2s
Standard Normal Probability Distribution • Characteristics A random variable having a normal distribution with a mean of 0 and a standard deviation of 1 is said to have a standard normal probability distribution.
Standard Normal Probability Distribution • Characteristics The letter z is used to designate the standard normal random variable. s = 1 z 0
Standard Normal Probability Distribution • Converting to the Standard Normal Distribution We can think of z as a measure of the number of standard deviations x is from .
Standard Normal Probability Distribution • Example: Pep Zone Pep Zone sells auto parts and supplies including a popular multi-grade motor oil. When the stock of this oil drops to 20 gallons, a replenishment order is placed. The store manager is concerned that sales are being lost due to stockouts while waiting for a replenishment order.
Standard Normal Probability Distribution • Example: Pep Zone It has been determined that demand during replenishment lead-time is normally distributed with a mean of 15 gallons and a standard deviation of 6 gallons. The manager would like to know the probability of a stockout during replenishment lead-time. In other words, what is the probability that demand during lead-time will exceed 20 gallons? P(x > 20) = ?
Standard Normal Probability Distribution • Solving for the Stockout Probability Step 1: Convert x to the standard normal distribution. z = (x - )/ = (20 - 15)/6 = .83 Step 2: Find the area under the standard normal curve to the left of z = .83. see next slide
Standard Normal Probability Distribution • Cumulative Probability Table for the Standard Normal Distribution P(z< .83)
Standard Normal Probability Distribution • Solving for the Stockout Probability Step 3: Compute the area under the standard normal curve to the right of z = .83. P(z > .83) = 1 – P(z< .83) = 1- .7967 = .2033 Probability of a stockout P(x > 20)
Standard Normal Probability Distribution • Solving for the Stockout Probability Area = 1 - .7967 = .2033 Area = .7967 z 0 .83
Standard Normal Probability Distribution • Standard Normal Probability Distribution If the manager of Pep Zone wants the probability of a stockout during replenishment lead-time to be no more than .05, what should the reorder point be? --------------------------------------------------------------- (Hint: Given a probability, we can use the standard normal table in an inverse fashion to find the corresponding z value.)
Standard Normal Probability Distribution • Solving for the Reorder Point Area = .9500 Area = .0500 z 0 z.05
Standard Normal Probability Distribution • Solving for the Reorder Point Step 1: Find the z-value that cuts off an area of .05 in the right tail of the standard normal distribution. We look up the complement of the tail area (1 - .05 = .95)
Standard Normal Probability Distribution • Solving for the Reorder Point Step 2: Convert z.05 to the corresponding value of x. x = + z.05 = 15 + 1.645(6) = 24.87 or 25 A reorder point of 25 gallons will place the probability of a stockout during leadtime at (slightly less than) .05.
Normal Probability Distribution • Solving for the Reorder Point Probability of no stockout during replenishment lead-time = .95 Probability of a stockout during replenishment lead-time = .05 x 15 24.87
Standard Normal Probability Distribution • Solving for the Reorder Point By raising the reorder point from 20 gallons to 25 gallons on hand, the probability of a stockout decreases from about .20 to .05. This is a significant decrease in the chance that Pep Zone will be out of stock and unable to meet a customer’s desire to make a purchase.