Map Reading
Map Reading. Map Reading. Learning Outcome 1 : Know about the scales and features of Ordnance Survey maps. Definition. Map Noun Flat representation of the earth or some part of it with its physical or political features or of the heavens. History.

Map Reading
E N D
Presentation Transcript
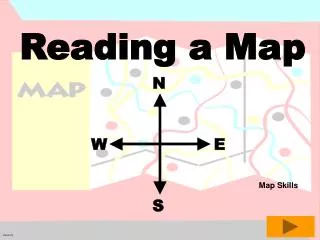
MapReading Learning Outcome 1: Know about the scales and features of Ordnance Survey maps
Definition Map Noun Flat representation of the earth or some part of it with its physical or political features or of the heavens
History Ever since man has been able to write and draw there is evidence to also show that he has recorded routes on land and sea. Where maps were originally shown on clay tablets and papyrus, we can now display them on paper and even CD Rom!
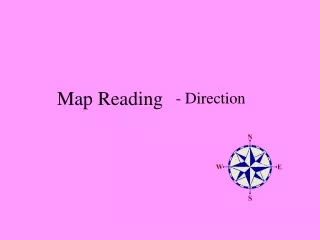
The World • The earth is a sphere (oblate spheroid if you want to be precise!) • Rotates on its axis – North / South pole (called True North / True South) • An imaginary line runs around the middle dividing North “hemisphere” and South “Hemisphere” – called the Equator
Curved or Flat? • The world is a sphere • Maps are flat • So how do you make a curved spherical earth fit • on a flat piece of paper?
Map Projections One big lie! • Flat maps are a compromise of accuracy over practicality • Squashed, pulled and distorted versions of the globe • As the maps we use represent small areas, then distortion is negligible
Modern Maps • Very Accurate • Created from satellite images and photographs • Are our interpretation of the world around us • Used for a variety of purposes
What kind of maps are there? • Examples… • Topographic – shows shape of land • Demographic – shows population info • Synoptic – shows weather info • Political – shows boundaries, major cities • Historical, marine, outline
Topographic Maps • Show: • Relief (hills, valleys, cliffs, etc) • Drainage (rivers, lakes, steams, etc) • Vegetation (forests, trees, swamps, etc) • Man-made features (towns, canals, phone boxes, etc)
The Ordnance Survey Map Ordnance Surveymaps come in a variety of different formats and this guide will show you how to choose which one is best suited for your own use.
Tourist Information National Grid
Types of Map The importance of choosing the right map
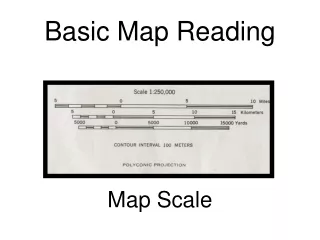
Map Scales • The higher the number on the right of the scale: • the bigger the area covered • The lower the detail • Detailed town planning – 1:5000 or 1:10000 • Air Navigation – 1:250000 or 1:1000000
1:50000 – Popular for walking • 1cm on the map represents 50000cm on the ground • 50000cm = 500m = 1/2km • 1 grid square = 2cm = 1km • Each map = 40km2 • 204 maps cover UK
1:25000 – Very detailed walking maps • 1cm on the map represents 25000cm on the ground • 25000cm – 250m = ¼km • 1 grid square = 4cm = 1km • Each map can also be double-sided • 403 maps cover UK
Map Revision • Maps get changed on a regular basis • Towns expand or change • Rivers get diverted or dammed etc. • Make sure your map is as up-to-date as possible • Check the Revision Date of the map
Looking after a Map • 1:50000 maps cost around £7 each • Maps need to be protected • Should always be folded properly • Avoid marking maps, and NEVER with a pen! (soft pencil only!)
The Key • Remember, that the symbols are relevant only to the map you are using! • Symbols change across different manufacturers maps, and may even change across different versions! • If in doubt about a symbol, check the key!
Symbols Ordnance Survey interpret both man made and natural features on the map, through a system of symbols. Every Ordnance Survey map has a key showing the definition of each symbol to help you. We will look at a few of the more common symbols.
Hills • Hills are shown using contour lines • Contour lines join areas of equal height • Marked at every 10m of height change • Rise and fall called “Vertical Interval” (VI) • Contour lines seem to disappear at cliffs