Download
1 / 42
430 likes | 659 Vues
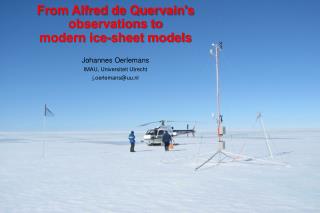
From Alfred de Quervain's observations to modern ice-sheet models Johannes Oerlemans IMAU, Universiteit Utrecht j.oerlemans@uu.nl. Crossing from Jakobshavn to Angmagssalik. • crevassed marginal zone • 'terraces' with large meltwater lakes up to 1530 m asl

E N D
From Alfred de Quervain's observations to modern ice-sheet models Johannes Oerlemans IMAU, Universiteit Utrecht j.oerlemans@uu.nl
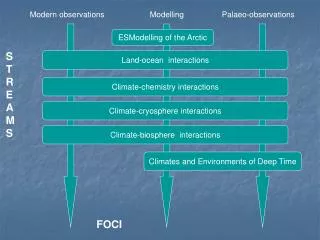
Crossing from Jakobshavn to Angmagssalik • crevassed marginal zone • 'terraces' with large meltwater lakes up to 1530 m asl • very smooth surface over hundreds of kms • steeper melt zone without lakes • high mountains in coastal zone The Geographical Review 1923
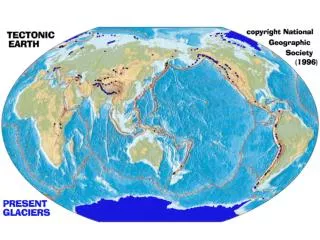
2000 3000 2000 The Geographical Review 1923 J. Lenearts, pers. comm .
The early explorers had no means to determine the ice thickness. De Quervain suspected that at the east coast the fjord system was penetrating inland under the ice for at least 100 km. Small irregularities in the smooth surface were supposed to be expressions of bedrock undulations. De Quervain (1914) The thickness of the ice sheet was grossly underestimated !
accumulation melt and runoff equilibrium line icebergs icebergs icebergs ? accumulation – runoff – icebergs ≈ 0
About the surface mass balance • in the west: equilibrium line at 1450 – 1500 m asl • in the east: equilibrium line at 1000 – 1100 m asl • annual accumulation in the interior of the inland ice: 0.35 m water eq In the expedition report, the following factors are mentioned to explain the relatively large altitude of the equilibrium line: - decreasing precipitation towards the interior - greater brightness of the sun - general anti-cyclonic weather
Ablation in the western melt zone: De Quervain's expedition R S W van de Wal, W Boot, C J P P Smeets, H Snellen, M R van den Broeke and J Oerlemans (2012): Twenty-one years of mass balance observations along the K-transect, West Greenland. Earth System Science Data 4, 31-35.
Ideas on the total mass budget • averaged precipitation in the 'accumulator': 0.36 mwe • averaged ablation in the 'dissipator': 0.95 mwe • a budget calculation showed that the ice sheet was in good shape, and should have a production of icebergs equivalent to 0.08 mwe
Ideas on the stability of the ice sheet 'We may ask whether such a glacier could start under present general climatic and topographic conditions' De Quervain (1914): The influence of heavier precipitation would preponderate over that of the higher temperature and result in the formation of a new ice sheet Brooks (1923): It does not seem likely that the ice could have started forming in the interior, for the snowfall on an upland so far from the coast would be insufficient to survive the summer melting.
Early theory of ice sheets Bodvarsson (1955), Robin (1955), Vialov (1958), Nye (1959), and, above all, Johannes WEERTMAN • glaciers always try to reduce the spatial variations in internal stresses • the basal shear stress dominates and is proportional to slope and ice thickness -> steep surface means small thickness and the other way around => application of perfect plasticity theory
surface height h ice thickness H x shear concentrated at base: perfect plasticity
shear concentrated at base: perfect plasticity ice cap on a flat bed:
in agreement with field obervations... J. Alean
mean elevation equilibrium line E an ice sheet can only exist if !
Hysteresis equilibrium states:
equilibrium states: GIS AIS
Semi-bounded domain and sloping equilibrium line (Weertman, 1976):
Perfect plasticity: parabolic profile Does this differ much from a profile with simple shear and Glen’s law? Ice sheet profile for simple shear with Glen's law (Vialov, 1958): constant accumulation rate b ice sheet radius R .
Ice sheet profile for simple shear with Glen's law (Vialov): .
. Taylor-expansion to see how sensitive ice thickness is for for changes in: - accumulation rate - ice viscosity - ice-sheet radius
Some basic numbers area volume accumulation time scale (x1000 km2) (x1000 km3) (m/yr) (yr) ------------------------------------------------------------------------------------------------------- Antarctica 12000 26500 0.15 14722 Greenland 1700 2900 0.35 4873 glacier 0.02 0.002 1.50 67 ------------------------------------------------------------------------------------------------------- time scale = volume / (area x precipitation)
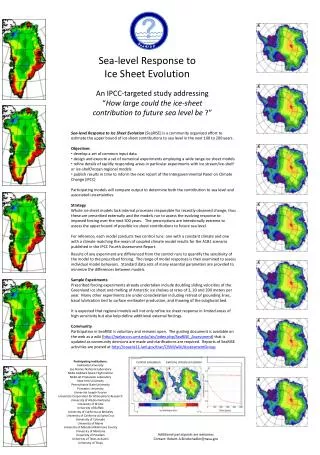
(1) Climatic variations during the Pleistocene were relatively large, with big ice sheets waxing and waning all the time. Do we understand this? (2) The global climate is warming, and will probably continue to do so. Will the Greenland and Antarctic ice sheets make a significant contribution to sea-level rise in the next 100-200 years?
Glacial Interglacial LGM PI
….and force a climate model (which includes ice sheets). IPCC (2007)
(1) Ice ages It needs much ‘calibration’# to get ‘reasonable results’ # tuning, fiddling • making an ice age start during an insolation minimum is difficult • hard to get fast deglaciation • too much ice in Asia • little generation of 100 kyr power
(2) Global warming – sea level • our diagnosis of the present state is poor • hard to quantify the ‘background signal’ => we have an initialization problem • uplift data • satellite (gravity anomalies, ice velocities, grounding line) • ice/snow radar (isochrones) • boreholes and ice/firn cores • sediment cores
How to achieve further progress in ice-sheet modelling ? It is all about the interfaces!
Antarctic ice sheet Sea level rise due to melting land ice, scaled with the global mean. Greenland ice sheet glaciers Mitrovica (2006)
…een mogelijk scenario… AD 2000 AD 2100 0 AD 90 000 AD 5 000 000 +3 °C -5 °C -30 °C
• summer insolation in NH decreases • ice sheet starts to grow • height-mass balance feedback effective • albedo-feedback becomes effective • atmospheric CO2 concentration decreases • strong sinking of bed (delays growth) • ice sheet warms up (more sliding) • precip in the northern part decreases • summer insolation increases • ice sheet is thinner because of extensive sliding • atmospheric CO2 concentration increases • high calving rates due to delayed bed response • full decay Arctic O. south Arctic O. Arctic O. Arctic O. time
surface balance rate mm w.e. Van den Berg et al (2006)
Greenland, 2100 AD it is gorgeous here! yeah, but I worry… it seems that CO2-emissions decline dramatically!