Download
1 / 35
380 likes | 648 Vues
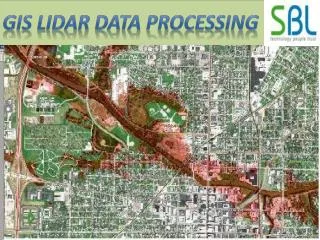
Merrick & Company Kenny Legleiter Senior Government Account Manager. Acquisition and Processing of LiDAR Data. Merrick & Company. World Headquarters: Aurora, Colorado Founded in 1955 Primary Services: GeoSpatial Solutions Surveying Architecture Civil Engineering

E N D
Merrick & Company Kenny Legleiter Senior Government Account Manager Acquisition and Processing of LiDAR Data
Merrick & Company • World Headquarters: Aurora, Colorado • Founded in 1955 • Primary Services: • GeoSpatial Solutions • Surveying • Architecture • Civil Engineering • Facilities Engineering • Process Engineering • 470 employees within 8 national and international offices • Annual revenue = $60M • Ownership: Private (employee-owned)
Flight Planning How are LiDAR Projects Planned?
Flight Planning Considerations and Contributing Factors: • Planned altitudes based on accuracy, terrain and morphology(i.e., vegetation, urban, etc.) • End user applications • Eye safety considerations (3D planning) • Land use characteristics • Land cover characteristics • Restricted flight areas • Weather factors
Flight Planning (cont.) • Multiple altitudes in high relief areas to maintain accuracy (analogous to scale breaks) and eye safety • Day/Night flying requires multiple crews (pilot, ground support, and operator) – this can become costly • River projects cover more land area then is needed • Predetermine local coordination requirements • For remote areas, planning base station location ahead of time can save a lot of time
Mobilization • Mobilization cost to move aircraft and equipment to project site • Rates usually consist of rate per mile for aircraft plus per diem, labor hours, other cost (hanger, gas, etc.) • Combine multiple projects within a region to lower cost
Flight Mission • Airport coordination • Provide flight plans to FAA and others • Maintain eye safety altitudes • Larger cities more problematic • Restricted airspace surround military and sensitive government buildings (i.e., LANL, White House) • Daily evaluation of data • Fly “patch” lines for missing data
Flight Planning Different Specifications for different areas
Flight Line Verification • Verify coverage while still on-site • Guarantee all of the project area is covered • Review side overlap for data holidays • Review initial GPS solutions • Review is typically completed at the “home office” • Do not leave site until verification is completed
Field Verification • Calibration site • Random survey check points • RTK GPS • Large projects: usually 10-15 checkpoints per 100 square miles • Number and location of check points depends on project configuration
Survey Control Collection of survey control appropriate for use in LiDAR • Ground control points collected at places of constant slope, not justzero slope • Points on retaining walls, bridge edges, or any location near a breakline are inappropriate • Points on zero slope surfaces do not adequately test horizontal accuracy • Points on surfaces that represent “average reflectivity” • Control points on very reflective or very dark surfaces may introduce error since LiDAR elevation values are affected by intensity • Compare LiDAR shots to control with an understanding of the capabilities of the system • Control collected in areas where LiDAR cannot penetrate should not be confused with accuracy • Control collected in areas of standing water during the time of LiDAR collection will result in differences of positions since LiDAR does not model water accurately • Control network has equal distribution and appropriate density throughout the project area • Control point density of at least 10-15 points per 100 sq miles, with a minimum of 25, for average size projects
Survey Control Report • Works upon analyzing control point elevations compared to their vertical intersection point of the LiDAR TIN, depending on the user defined classes enabled and disabled • Only reports vertical accuracy • Contour Interval Wizard to choose from: • FGDC/NSSDA/FEMA • ASPRS Class 1, 2, or 3 • NMAS • RMSEz or Vertical Accuracy requirement can by manually input • Control is analyzed to TIN of DSM surface • Statistics report: • Average Z Error • Median Z Error • Minimum Z Error • Maximum Z Error • Standards report for PASS or FAIL for: • Average Z Error • RMSEz • Vertical Accuracy • Achievable Contour Interval report for: • FGDC/NSSDA/FEMA • ASPRS Class 1, 2, or 3 • NMAS • Selectable classes to analyze from • Tabular readout of all control information • Export control report to Excel file • Export DSM data for the 3 points forming the TIN of analysis for each control point
Potential Sources of Error • Ground Support • Erroneous reference station (horizontal or vertical) • GPS baseline distance too long (25 mile maximum) • No redundant GPS receivers in case a receiver malfunctions • GPS base station problems (not enough satellites, incorrect antenna height measurement, battery failure, vandalism, etc.) • Post-processing error (poor constraint network, lack of local control knowledge, datum transformation, and monument elevation, etc.) • Operator error
Potential Sources of Error (cont.) • Planning • Field of view too wide for adequate penetration in vegetation • Wider the FOV, less accurate on the outside of the flight line, bigger laser footprint, less vegetation penetration • Too small side overlap could cause data “holiday” or missing data • Inadequate project procedures and documentation • Poor communication with internal and external clients • No field and office data management plan • No quality control and ground truth plan • No eye safety plan
Potential Sources of Error (cont.) • Data Holidays, Voids, Etc. • Laser malfunctions • Poor flight planning or high cross winds can cause side overlap gaps • Voids caused by tall buildings (shadows) • Clouds scatter (below aircraft) • Water absorption • Road drop outs (poor SNR/flying to high) • Vegetation canopy too dense to penetrate • Low ground cover too dense to penetrate
LiDAR Calibration and Boresighting • Why is This Important?
Bore Sighting(Calibration) Corrects/adjusts roll, pitch, heading, and dynamic parameters
Breaklines • Do You Really Need Breaklines?
SpecificationsBreaklines • Breaklines enforce linear or area features into the LIDAR DEM, thus creating a DTM • Generally two types of breaklines • Traditional breakline features to meet accuracy specification • Hydro-enforced breaklines to define the hydrology, very useful for hydrologic & hydraulic modeling and other water resource studies • Be very specific on the specifications
Breakline Collection Approaches Photogrammetry • Traditional approach • Utilizes stereo models (3D) • Very Accurate • Very Costly • Time Consuming
Breakline Collection Approaches (cont.) Heads-up (2+ D) • Bare-earth LIDAR for vertical (Z) • Effective terrain modeling in vegetated areas • ~30% less cost in development • NSSDA (FEMA) surface accuracy requirements • * software dependent
Hydro Breaklines • Hydro breaklines provided allow for DTM development that provides accurate terrain for watershed modeling, hydraulic & hydrologic modeling, drainage area delineation, and stream channel geomorphology studies • Breaklines will go around islands in rivers, lakes, etc. • Waterbodies will be flattened
LiDAR and Aerial Imagery Project in Southwest Missouri – Breaklines (cont.) • Linear Features – rivers, streams, ditches • Minimum length = client define • Double line breakline – client define • Breaklines around islands • Stream width greater = client define • How to handle culverts – hydro connector • Bridges – breaklines? • Dams – cut through?
LiDAR and Aerial Imagery Project in Southwest Missouri – Breaklines (cont.) • Waterbodies: Lakes, Ponds (does this include wetlands?) Minimum size of waterbody = client define (recommend ¼ acre)
If Breaklines are Not Compiled With LiDAR data, if breaklines are not specified, hydro features will not be as defined
Deliverables • How Do I Know What to Ask For?
Deliverables • LIDAR • LAS format (ASPRS LAS Specification) (recommended) • ASCII format Raster Elevation (DEM, DTM, etc.) • ESRI Grid • ASCII Grid • Tins
LAS Classifications Classification Codes Class 0 Created, never classified 1 Unclassified 2 Ground 3 Low Vegetation 4 Medium Vegetation 5 High Vegetation 6 Building 7 Low Point (noise) 8 Model Key-point (mass point) 9 Water 10 Reserved for ASPRS Definition 11 Reserved for ASPRS Definition 12 Overlap Points 13-31 Reserved for ASPRS Definition 32-255 Not reserved currently *Source: LAS Specification, Version 1.1 (www.lasformat.org)
Deliverables (cont.) • Contours • ESRI Geodatabase • ESRI Shapefile • AutoCAD • Breaklines • ESRI Geodatabase • ESRI Shapefile • AutoCAD • Metadata • xml
Derivative Products • Above-ground features (ex. vegetation canopy) • Hillshades • Impervious surface • Hydro geodatabase • Feature Extraction (ex. buildings, power lines, etc.) • Fused Datasets
Questions Kenny Legleiter Senior Government Account Manager Merrick & Company 303-353-3837 Kenny.legleiter@merrick.com www.merrick.com