Catalyst
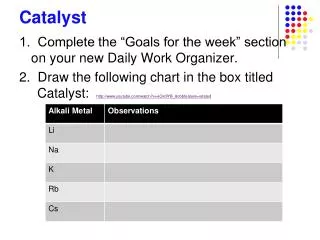
Catalyst. Create a Catalyst/Objective/Exit Ticket Sheet out of a piece of loose-leaf paper. On your Catalyst Sheet, complete the following: Name at least four different types of instruments used to gather weather data. Describe what each instrument measures. Catalyst Answers.

Catalyst
E N D
Presentation Transcript
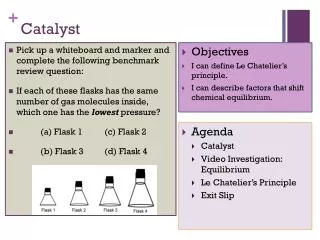
Catalyst • Create a Catalyst/Objective/Exit Ticket Sheet out of a piece of loose-leaf paper. • On your Catalyst Sheet, complete the following: • Name at least four different types of instruments used to gather weather data. • Describe what each instrument measures.
Catalyst Answers • Thermometer (temperature) • Barometer (air pressure) • Anemometer (wind speed) • Hygrometer (relative humidity) • Rain gauge (rainfall) • Ceilometer (height of cloud layers/amount of sky covered by clouds) • Radiosonde (temperature, air pressure, & humidity) • Doppler radar (wind speed in precipitation areas) • Weather satellites (cloud cover or surface temperatures)
Agenda • Catalyst • Announcements/Objective • Mini-Lesson: Becoming Meteorologists! • Group Work: Station Model Creation • Independent Reading: Forecasting • Partner Work: Accuracy in Forecasting • Closing/Exit Ticket • Homework Completion Time (if possible)
Announcements • Homework/Classwork • Can be found under “Classes/Homework” on the MMSA website if you miss a day.
Objective • By the end of class, CWBAT analyze and create station models and describe the benefits and drawbacks of different lengths of forecasts. • CRS: EMI.504 • Identify similarities and differences between models.
(Well, sort of anyway) Becoming Meteorologists!
Station Models • Records of weather data for a particular site at a particular time • Example: MMSA Campus at 2:00pm on 3/12 • Why use station models?
Station Models • Allows a large amount of information to be presented in a small space. • Uniform way for meteorologists to communicate weather data.
Reading Station Models *Check out Appendix E in your books!*
Weather Maps • Isopleths • Lines that connect equal or constant values • Values represent weather variables like pressure or temperature • What do these lines resemble from when we studied mapping? • Contour lines! (Lines of equal elevation)
Isopleths • Isobars • Lines of equal pressure
Isopleths • Isotherms • Lines of equal temperature
Reading Isobars • Can tell how fast wind is blowing • Isobars close together • Large pressure difference over small area • Strong winds • Isobars spaced far out • Very small difference in pressure over that area • Weak winds
Group Work • In groups of 3-4 (your choice!), complete the Station Model Creation Worksheet • EACH person needs to fill one out • First column: Interpret station model given • Second column: Draw station model based on information presented • *Use Appendix E in your books! • Page 915
Independent Reading/Pair Work • SILENTLY read/take notes on pages 318-321 • With your Table Partner, complete #2-5 in the Section Assessment on page 321 • One paper per pair • Put them in the INBOX when done
Table Partner Work • With your Table Partner, complete #2-5 in the Section Assessment on page 321 • One paper per pair • 15 minutes
Closing • By the end of class, CWBAT analyze and create station models and describe the benefits and drawbacks of different lengths of forecasts. • Thumbs-Up/Thumbs-Down
Exit Ticket • On your Catalyst Sheet, complete the following: • What is an isobar? • What does it mean if isobars are very close together on a map? • Why aren’t long-term forecasts as accurate as short-term ones?
Homework Time! • Use this time to complete the assignment • Due next class period